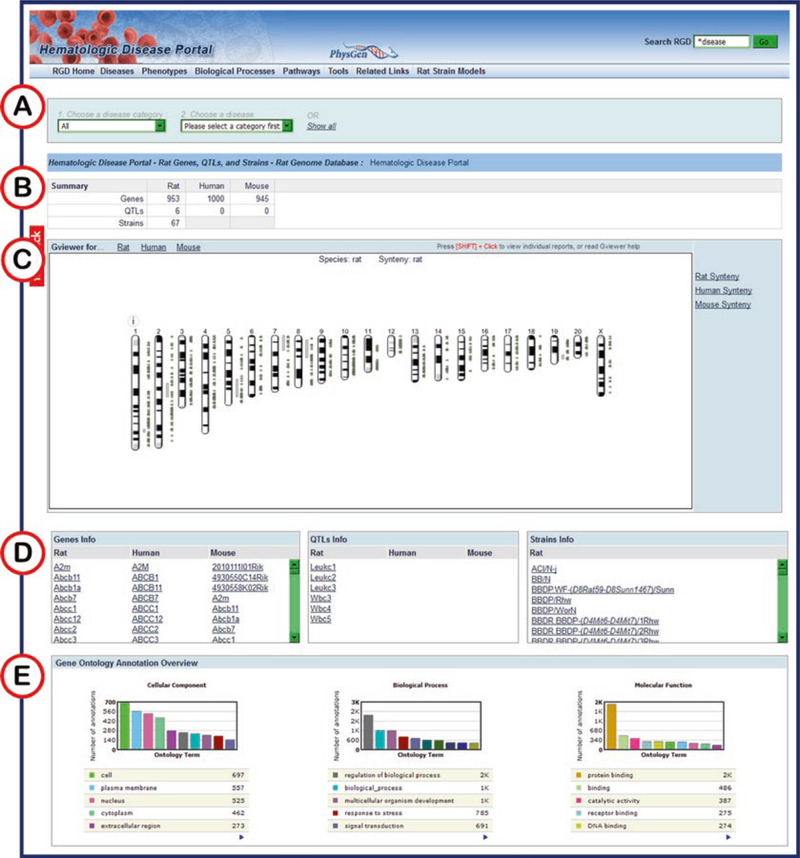
Fig. 12.
Hematologic Disease Portal Home Page. (A) Drop-down menus for selection of disease category and specific disease. (B) Numerical summary of results for the selected disease category/disease. (C) GViewer display of results with approximate positions of all genes, QTLs, and strains. (D) Lists of genes, QTLs, and strains annotated to selected disease category/disease. (E) Enrichment charts showing Gene Ontology annotations for all selected disease-annotated genes

