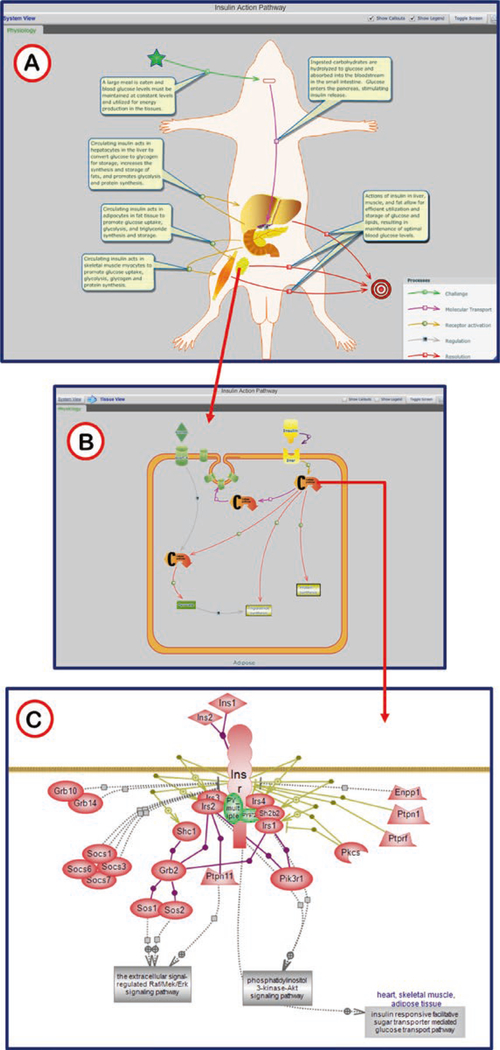
Fig. 18.
Insulin Action Pathway Diagram. (A) The system view gives the overall view of insulin action. The callout pop-ups for the separate processes can be toggled on and off by way of the check box in the upper right. In off mode individual callouts will show if the cursor hovers over a circle or square in the center of a process arrow. Organs may be identified by hovering the cursor over the organ image. (B) Detailed cellular pathways are visualized by clicking on the organ images (red arrow). As in the organismal view, hovering over parts of the diagram with reveal pop-up labels. (C) Individual molecular pathways are accessed by clicking any of the “Cellular pathway” icons in the cellular diagram (red arrow)

