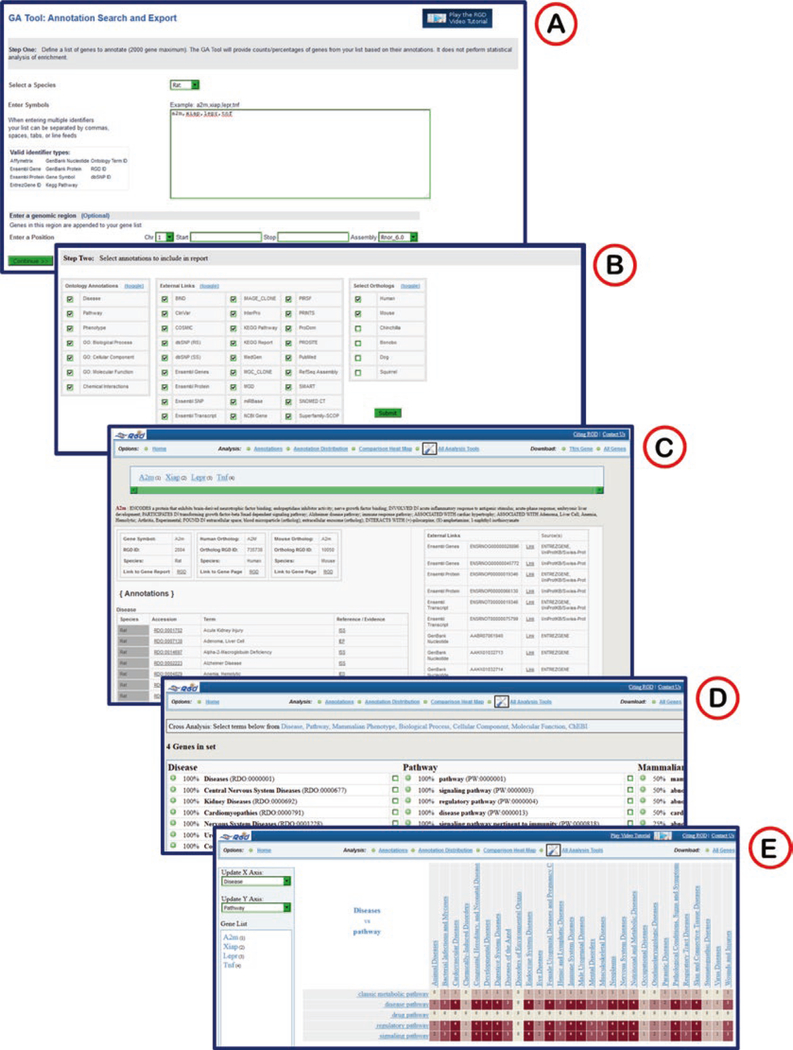
Fig. 23.
The Gene Annotator (GA) Tool. (A) The start page of the GA tool with large text box for entry of gene lists or object identifiers. (B) The results selection page where category of ontology annotations, external links, and orthologs may be chosen. (C) Results page listing annotations and external links for the rat, human, and mouse A2M genes. (D) Annotation distribution shows what percentage of the gene list is annotated to lists of terms in various ontologies/vocabularies. (E) The Comparison Heat Map shows an interactive matrix comparing numbers of annotated genes between terms of the disease vocabulary and the pathway ontology

