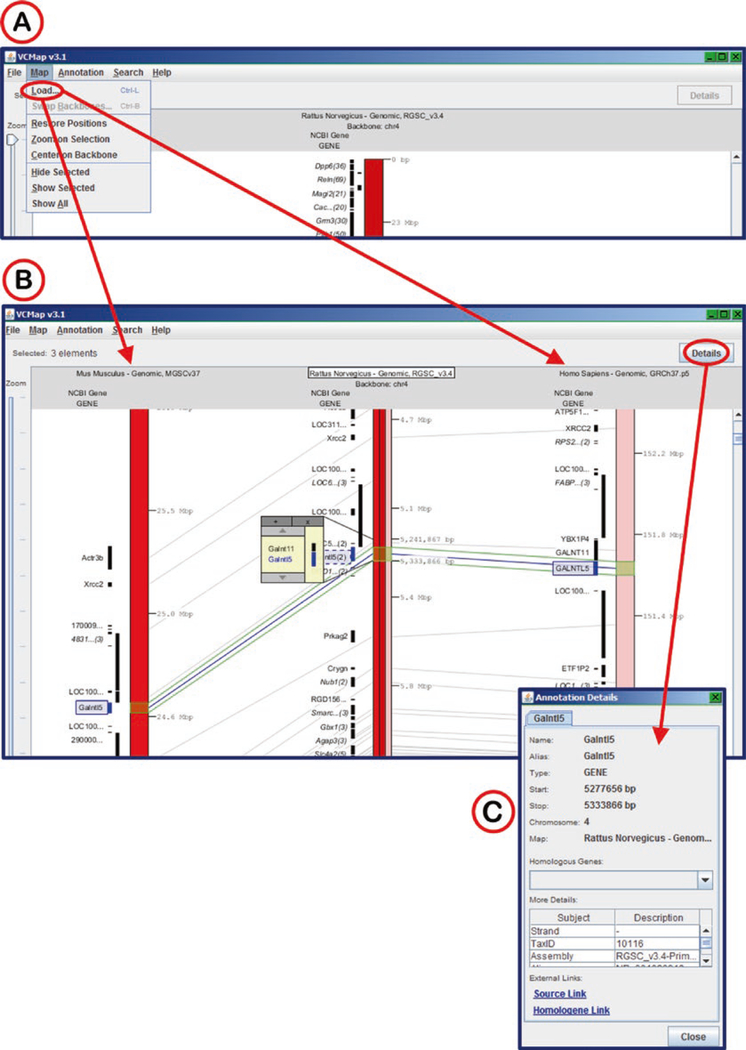
Fig. 37.
Using VCMap for Interspecies Comparisons. (A) Choosing mouse and human maps for comparison to rat. (B) Display of mouse and human homologous chromosomes as compared to rat. The Galntl5 gene orthologs have been selected and are highlighted in blue across the three species. (C) Annotation details pop-up window for rat Galntl5

