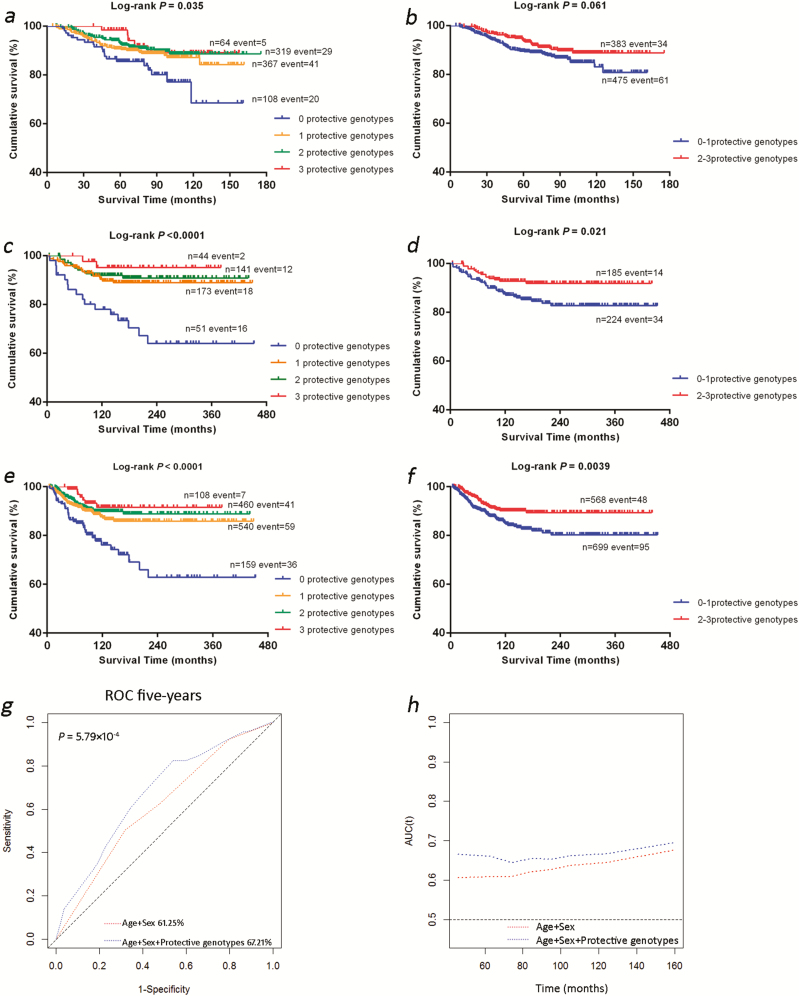
Figure 2.
The independent SNPs and CMSS. (a–f) Kaplan–Meier survival curves of the protective genotypes: the exact numbers of protective genotypes in the (a) MDACC study, (c) Harvard study and (e) combination of these two datasets; dichotomized groups of protective genotypes in the (b) MDACC study, (d) Harvard study and (f) combined dataset. (g and h) Receiver operating characteristic (ROC) curve and time-dependent area under the curve (AUC) estimation for prediction of melanoma-specific survival in the combined dataset. (g) Five-year melanoma-specific survival prediction by ROC curve; (h) time-dependent AUC estimation based on age, sex and the protective genotypes of the three genes.

