
Figure 1.
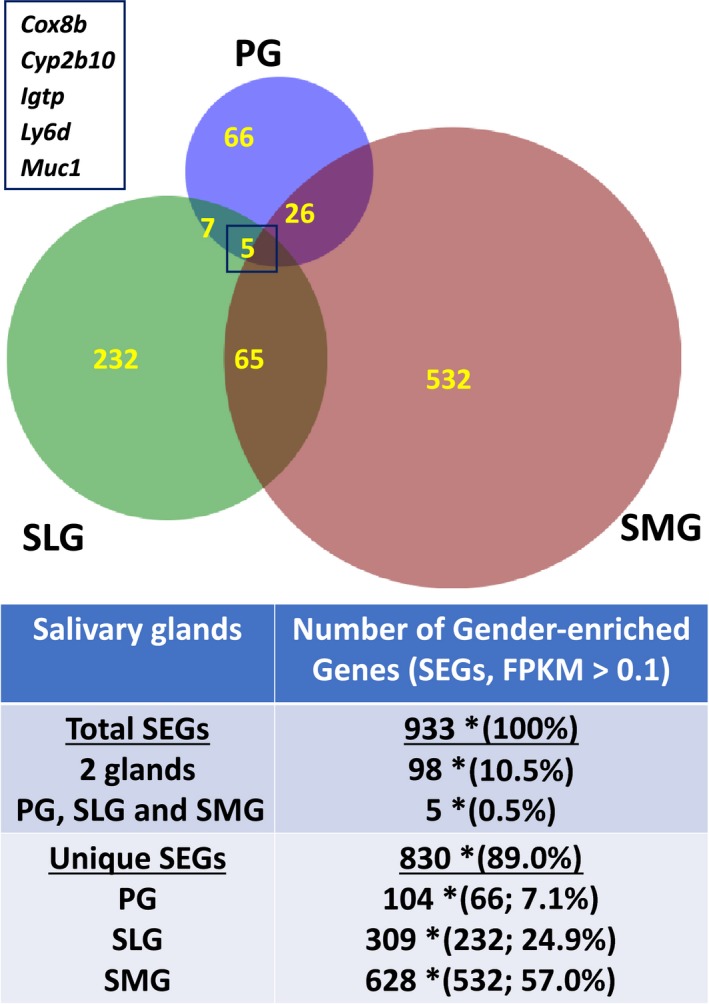
Comparison of SEGs among the murine major salivary glands. Venn diagram: the relationship between the number SEGs in the PG, SLG, and SMG, as listed in Table S1, with an FPKM cutoff value of ≥ 0.1, q < 0.05. Inset: list of five common SEGs in all three salivary glands. Table: total SEGs: total number of SEGs expressed in the three salivary glands (n = 933), number of SEGs expressed in at least two salivary glands (n = 98), and number of SEGs found in all three salivary glands (n = 5). *Data in brackets represent the percentage of SEGs in two (10.5%) or all three gland types (0.5%) relative to the total number of expressed SEGs (100%). Unique SEGs: total number of uniquely expressed SEGs in the three salivary glands (n = 830, 89% of total expressed SEGs) and the total number of SEGs found in individual salivary glands (PG = 104, SLG = 309, SMG = 628). *Data in brackets represent the number and percentage of unique SEGs in a single gland type relative to the total number of SEGs expressed in all three salivary glands. n = 6 for each gland type consisting of three male and three female glands.