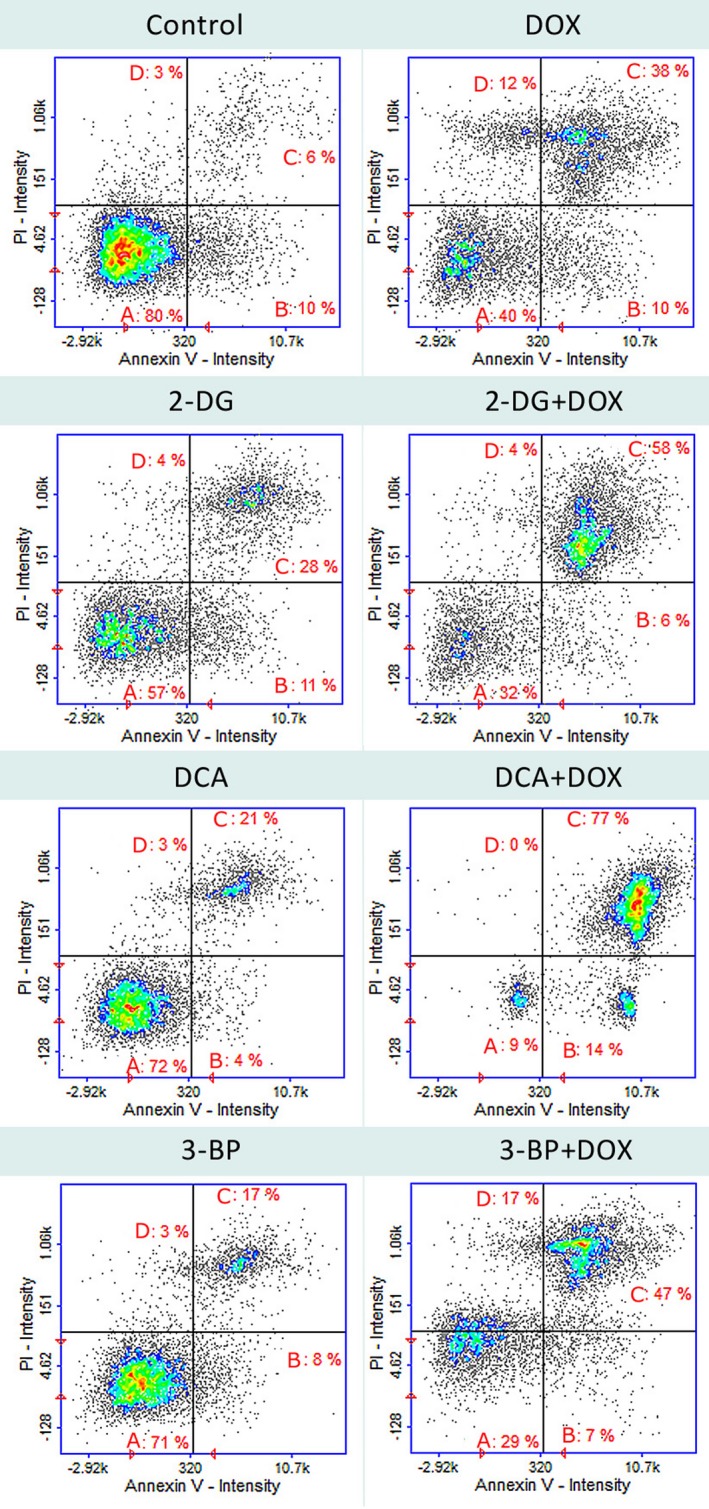
Figure 2.

Cell apoptosis/necrosis of HepG2 cells, stained with annexin V–FITC and propidium iodide for image cytometry. (A) Live, (B) early apoptotic, (C) late apoptotic and (D) necrotic cells. The results show one representative experiment of three independently performed that showed similar patterns.
