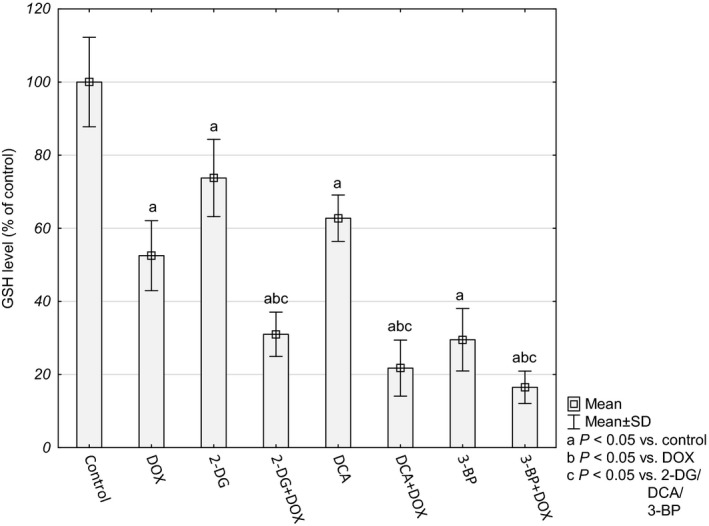
Figure 6.

GSH level in HepG2 cells presented as percentage of control cultures, which were averaged to define 100%. Values are presented as mean ± SD derived from three independent experiments. To compare more than two groups, one‐way ANOVA and post hoc multiple comparisons with Tukey's HSD test were used.
