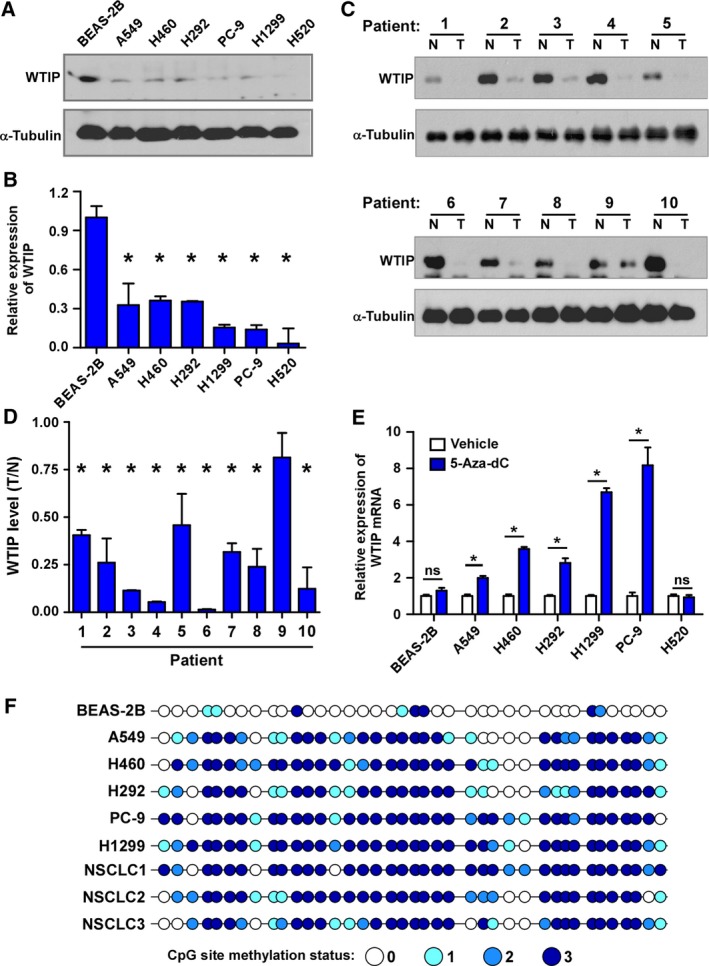
Figure 1.

Promoter methylation leads to WTIP downregulation in NSCLC. Western blotting (A, C) and real‐time PCR (B, D) analysis of WTIP expression in NSCLC cell lines and paired NSCLC tumor and nontumor tissues. (E) Real‐time PCR analysis of WTIP mRNA levels in the indicated cells treated with vehicle or 5‐Aza‐dC for 72 h. Error bars represent the mean ± SD obtained from three independent experiments. *P < 0.05, unpaired t‐test. (F) Bisulfite genomic sequencing of three individual clones reveals the methylation status of CpG islands in the WTIP promoter in the indicated specimens. The methylation status of the CpG sites from three individual clones was distinguished by different shades of blue as indicated. N, nontumor. T, tumor.
