Figure 5.

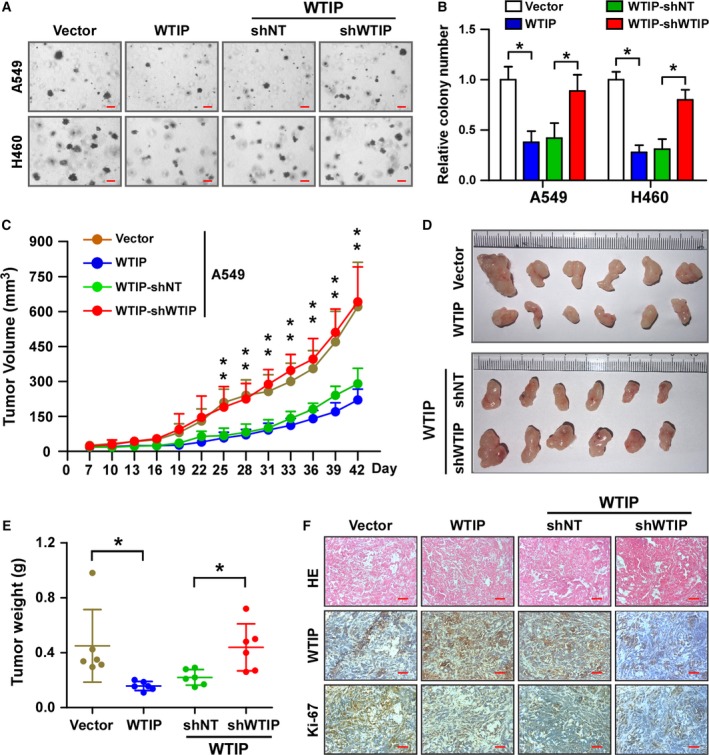
WTIP inhibits tumorigenicity of NSCLC in vitro and in vivo. Representative pictures (A) and quantification (B) of colony formation as analyzed by anchorage‐independent growth. Pictures were taken at 40× magnification. Scale bars, 0.2 mm. Error bars represent the mean ± SD obtained from three independent experiments. *P < 0.05, unpaired t‐test. (C–F) Xenograft model in nude mice. Different groups of A549 cells were subcutaneously injected into nude mice. (C) Growth curve of the tumor volumes measured on the indicated days. Error bars represent the mean ± SD. *P < 0.05, unpaired t‐test. (D and E) Representative pictures of tumor growth (D) and tumor weights (E) 42 days after inoculation. Error bars represent the mean ± SD. *P < 0.05, unpaired t‐test. (F) Representative pictures of H&E staining and IHC staining of WTIP and Ki‐67 in the indicated xenografted tumors. Scale bars, 50 μm.
