Figure 6.

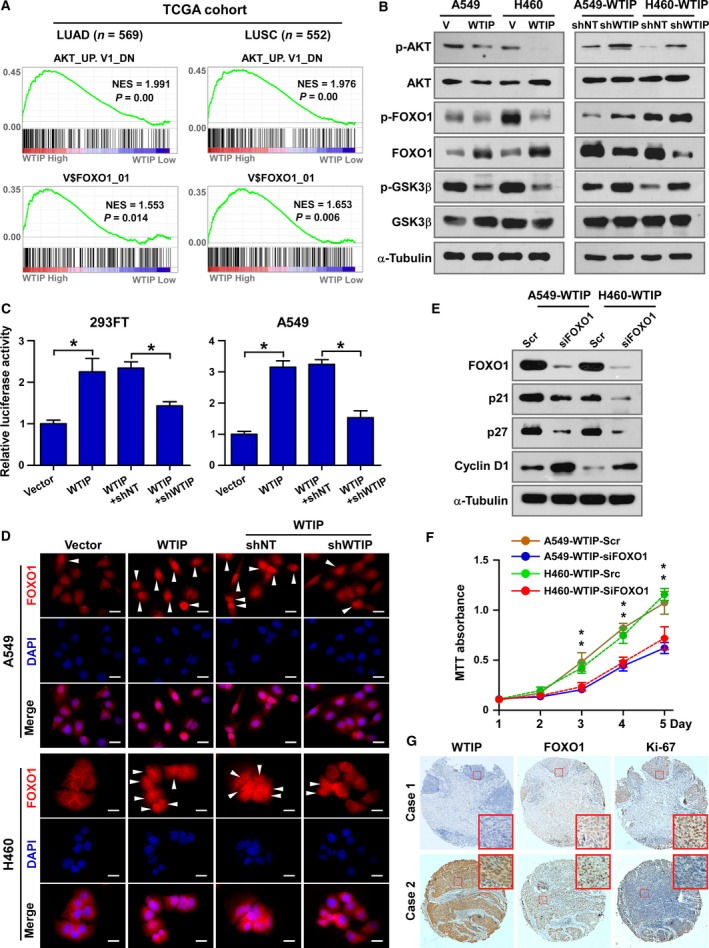
WTIP expression correlates with FOXO1 activation in NSCLC. (A) GSEA plot showing that WTIP expression is positively correlated with the AKT‐downregulated gene signature (AKT_UP. V1_DN) and FOXO1‐targeted gene signature (V$FOXO1_01) in the gene expression profiles of LUAD and LUSC patients from the TCGA database. (B) Western blotting analyses of the expression of phosphorylated AKT (p‐AKT), total AKT, phosphorylated FOXO1 (p‐FOXO1), total FOXO1, phosphorylated GSK‐3β (p‐ GSK‐3β), and total GSK‐3β. α‐Tubulin served as a loading control. (C) Relative FOXO1 luciferase reporter activity in 293FT and A549 cells transfected with the indicated plasmids. *P < 0.05, unpaired t‐test. (D) Representative pictures of FOXO1 immunostaining. White arrows, cell with nucleus retained FOXO1. Pictures were taken at 630× magnification. Scale bars, 20 μm. (E) Western blotting analyses of the expression of FOXO1, p21, p27, and cyclin D1. α‐Tubulin served as a loading control. (F) MTT assay analysis of cell growth of the indicated cells. Error bars represent the mean ± SD obtained from three independent experiments. *P < 0.05, unpaired t‐test. (G) IHC staining analysis of WTIP, FOXO1, and Ki‐67 expression in NSCLC patient specimens.
