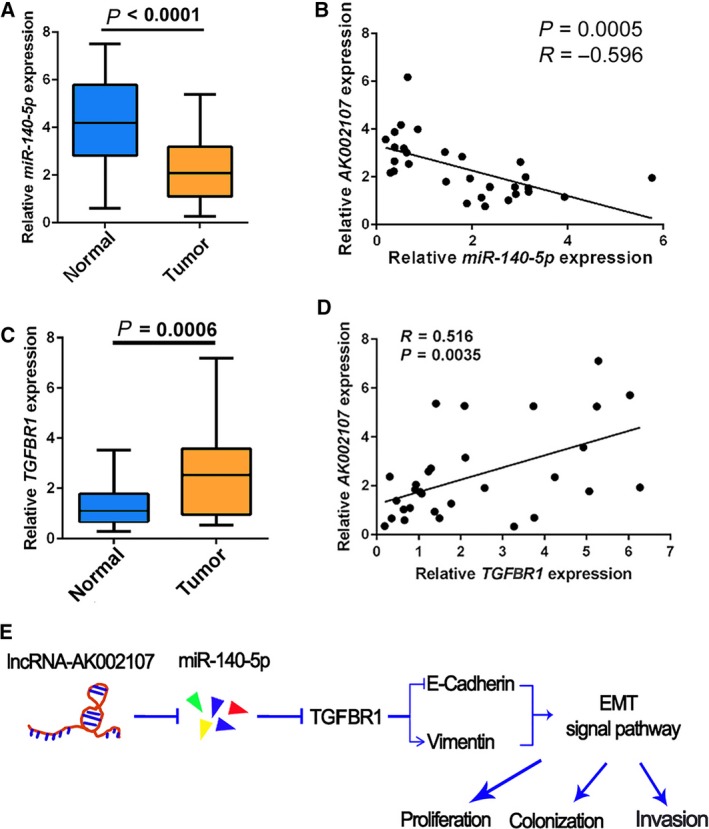
Figure 7.

Expression of miR‐140‐5p and TGFBR1 and the correlations between lncRNA AK002107 and miR‐140‐5p and TGFBR1 expression in HCC tissues. (A) The expression of miR‐140‐5p was analyzed in thirty fresh HCC samples and adjacent noncancerous tissues using qRT‐PCR. Results expressed as the means ± SDs. Student's t‐test was performed for statistical comparisons. P < 0.0001, (B) Correlations between the expression of lncRNA AK002107 and miR‐140‐5p were analyzed using Spearman's rank correlation analysis. (C) TGFBR1 expression in thirty fresh HCC samples and adjacent noncancerous tissues was analyzed using qRT‐PCR. Results expressed as the means ± SDs. Student's t‐test was performed for statistical comparisons. P = 0.006. (D) Correlations between the expression of lncRNA AK002107 and TGFBR1 were analyzed using Spearman's rank correlation analysis. (E) Schematic of the lncRNA AK002107/miR‐140‐5p/TGFBR1/EMT regulatory network in HCC.
