
Figure 1.
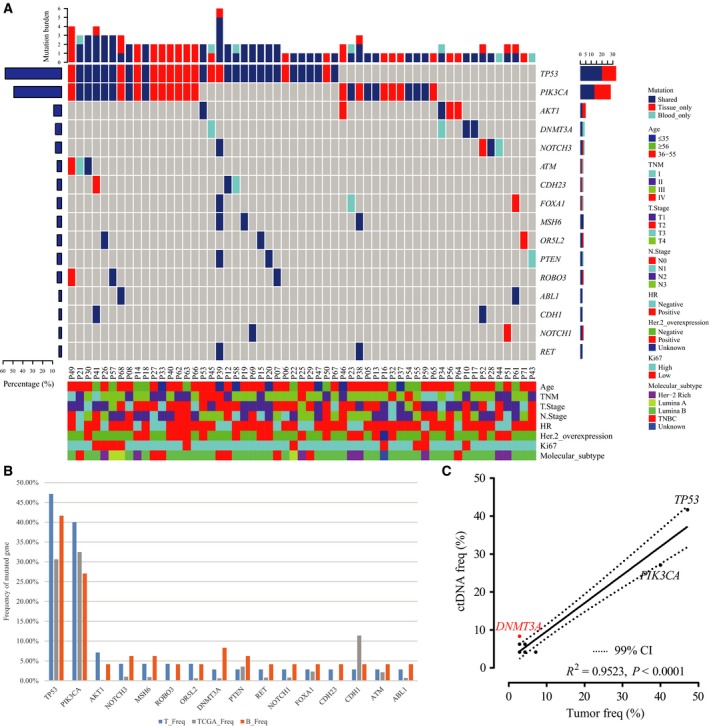
Genomic profiling of tumor DNA, ctDNA, and public database sequences reveals strong associations between mutations in tumor DNA and ctDNA. (A) Prevalence of mutated genes in tumor DNA and ctDNA. The top 16 genes mutated in ctDNA are listed. The bar chart below shows the clinical features of patients, while the bar chart above shows the number of genes altered in each patient. The right bar represents the frequency of specific altered genes in the total cohort. (B) Comparison of gene mutation rates in tumor DNA, ctDNA, and TCGA sequences (SNVs and insertions/deletions). (C) Correlation between mutation rates in ctDNA and tumor DNA.