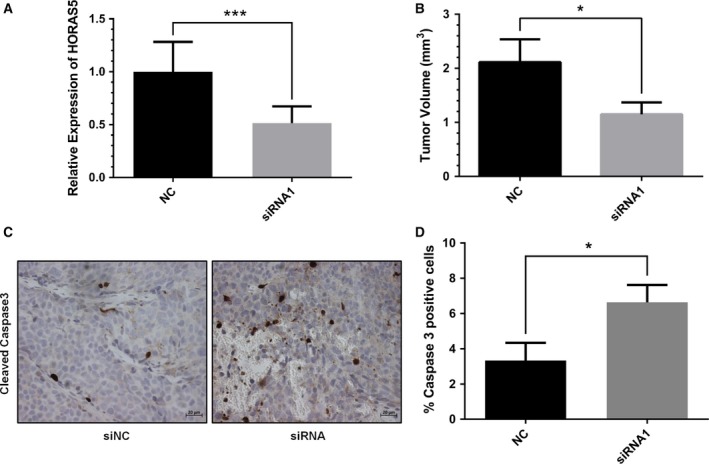
Figure 6.

HORAS5 knockdown attenuates tumor growth in vivo. (A) Relative expression of HORAS5 (qPCR) 72 h following AteloGene:siRNA injections (n = 3 in each arm). Raw values were normalized to GAPDH and HPRT1 and shown relative to the control group (***P < 0.001). (B) Quantitative measurements of tumor volume postknockdown of HORAS5 (72 h). Statistical significance from Student's t‐test with *P < 0.05. (C) Representative IHC images for cleaved Caspase 3 from control siRNA (NC) and anti‐HORAS5 siRNA treatment groups. The scale bar at the bottom marks a 20 μm width. (D) Overall IHC staining quantification from C. Results are expressed as percent of positive cells to total cells in the visual field. Data are shown as means ± SD, and a Student's t‐test was used to calculate significance, *P < 0.05.
