
Figure 3.
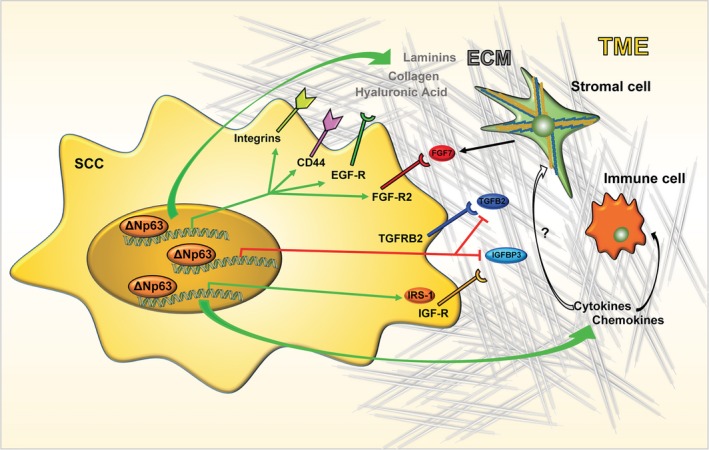
Schematic model of the ΔNp63 oncogenic routes in SCC. The green and red arrows indicate the pathways under positive and negative regulation by ΔNp63, respectively. See text for details.
Official websites use .gov
A
.gov website belongs to an official
government organization in the United States.
Secure .gov websites use HTTPS
A lock (
) or https:// means you've safely
connected to the .gov website. Share sensitive
information only on official, secure websites.
Schematic model of the ΔNp63 oncogenic routes in SCC. The green and red arrows indicate the pathways under positive and negative regulation by ΔNp63, respectively. See text for details.