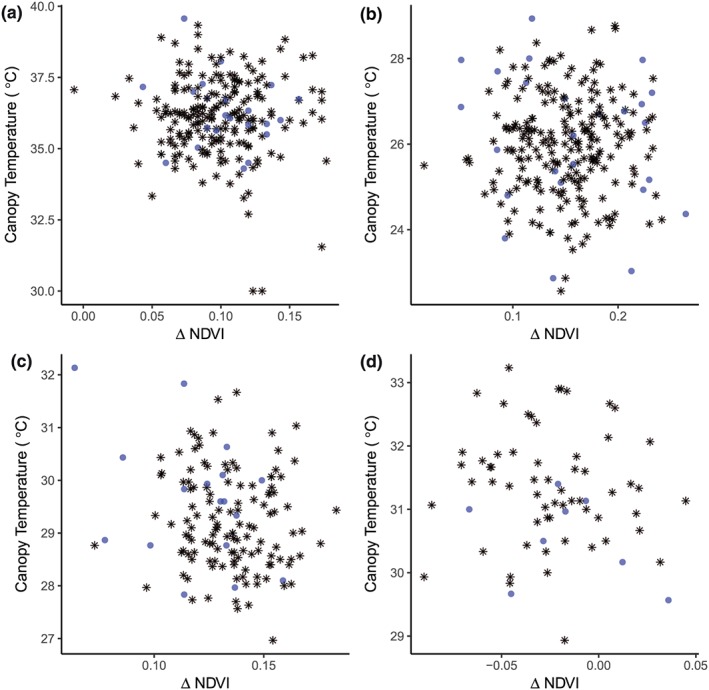
Figure 1.

Relationship between ΔNDVI and CT within a panel of ~220 aus rice genotypes in three field dry seasons under drought stress: (a) 2010 (ΔNDVI 68–74 DAS, CT 76 DAS); (b) 2011 (ΔNDVI 83–89 DAS, CT 89 DAS), (c) 2012 early maturing group (ΔNDVI 64–70 DAS, CT 70 DAS); (d) 2012 medium maturing group (ΔNDVI 71–74 DAS, CT 74 DAS). Twenty‐six genotypes selected for detailed measurements from the first field season are indicated by blue circles. Values shown are genotypic means
