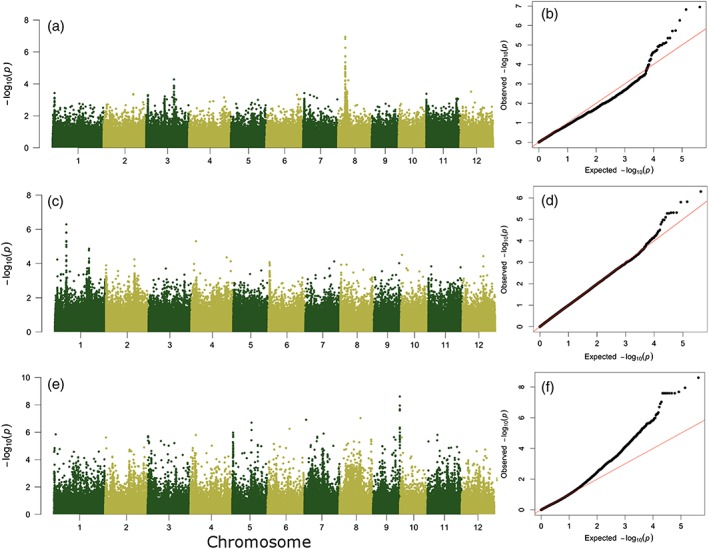
Figure 4.

Manhattan plots and quantile‐quantile plots of genome‐wide association analysis in the aus panel for (a,b) leaf rolling score in the greenhouse lysimeter study, (c,d) change in NDVI in the 2011 field drought trial, and (e,f) leaf rolling score in the 2012 field drought trial on medium‐duration genotypes (106 DAS)
