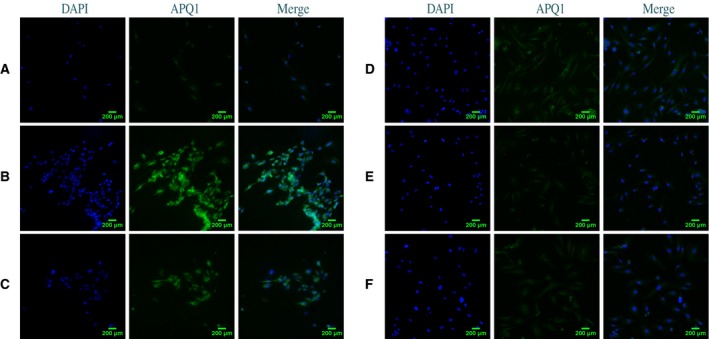
Figure 2.

AQP1 immunofluorescence changes after treated with HMGB1 or HMGB1 combined with escin in cultured ECs. (A) Normal AQP1 expression intensity in ECs. (B) Treatment with HMGB1 (100 ng·mL−1) for 24 h significantly increased AQP1 expression intensity and produced some deformity of ECs. (C) Treatment with HMGB1 (100 ng·mL−1) combined with escin (10 μg·mL−1) for 24 h led to a comparatively reduced AQP1 expression intensity. (D–F) AQP1 expression intensity was significantly decreased when ECs were treated with HMGB1 (100 ng·mL−1) combined with escin (20 μg·mL−1) for 12, 18, or 24 h. Scale bar = 200 μm.
