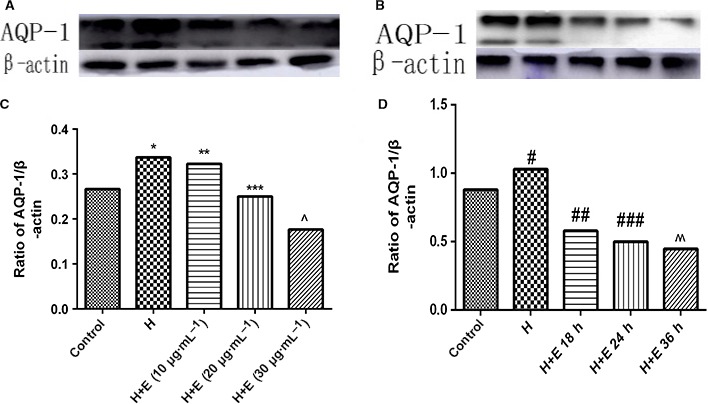
Figure 3.

Western blot analysis of expression of AQP‐1 after treated with HMGB1 or HMGB1 combined with escin in cultured ECs. (A) Representative western blot band images for AQP‐1 after challenge with control, 100 ng·mL−1 HMGB1, 100 ng·mL−1 HMGB1 + 10 μg·mL−1 escin, 100 ng·mL−1 HMGB1 + 20 μg·mL−1 escin or 100 ng·mL−1 HMGB1 + 30 μg·mL−1 escin at 37 °C for 24 h. (B) Relative ratio of band intensities of AQP‐1 over β‐actin after challenge with control, 100 ng·mL−1 HMGB1, 100 ng·mL−1 HMGB1 + 10 μg·mL−1 escin, 100 ng·mL−1 HMGB1 + 20 μg·mL−1 escin or 100 ng·mL−1 HMGB1 + 30 μg·mL−1 escin at 37 °C for 24 h. (C) Representative western blot band images for AQP‐1 after challenge with control, 100 ng·mL−1 HMGB1 + 20 μg·mL−1 escin for 12, 18, or 24 h, respectively. (D) Relative ratio of band intensities for AQP‐1 over β‐actin after challenge with control, 100 ng·mL−1 HMGB1 + 20 μg·mL−1 escin for 12, 18, or 24 h, respectively. Band intensities were acquired by image j and presented as mean ± SD, n = 3. Data were compared by unpaired Student's t‐test. *P < 0.05 vs control group; **P < 0.05 vs H group; ***P < 0.05 vs H + E (10 μg·mL−1) group; ^P < 0.05 vs H + E (20 μg·mL−1) group; # P < 0.05 vs control group; ## P < 0.05 vs H group; ### P < 0.05 vs H + E 18 h group; ^^P < 0.05 vs H + E 24 h group. H, HMGB1; E, escin.
