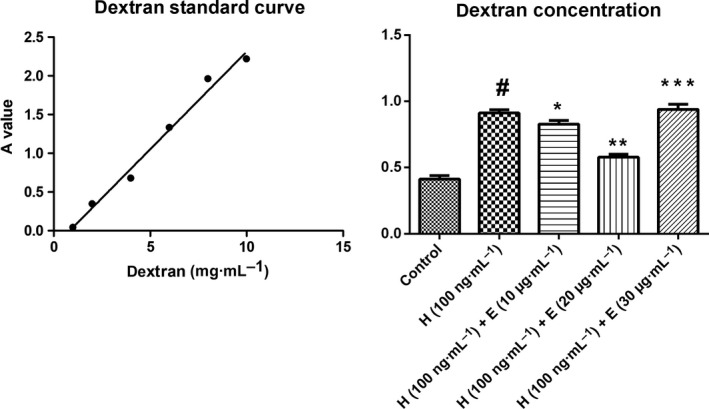
Figure 5.

Effects of HMGB1 and escin on FITC‐dextran diffusion through the human endothelial cell monolayer. Cells were challenged with control, 100 ng·mL−1 HMGB1, 100 ng·m−1 HMGB1 + 10 μg·mL−1 escin, 100 ng·mL−1 HMGB1 + 20 μg·mL−1 escin or 100 ng·mL−1 HMGB1 + 30 μg·mL−1 escin at 37 °C for 24 h, and the amount of FITC‐dextran diffused through the monolayer was measured 90 min after its addition on top of the monolayer. The amount of FITC‐dextran was normalized according to a standard curve; data from three independent experiments were pooled and presented as mean ± SD. Data were compared by unpaired Student's t‐test. #P < 0.05 vs control group; *P < 0.05 vs H group; **P < 0.05 vs H (100 ng·mL−1) + E (10 μg·mL−1) group; ***P < 0.05 vs H (100 ng·mL−1) + E (20 μg·mL−1) group. H, HMGB1; E, escin. Scale bar = 50 μm.
