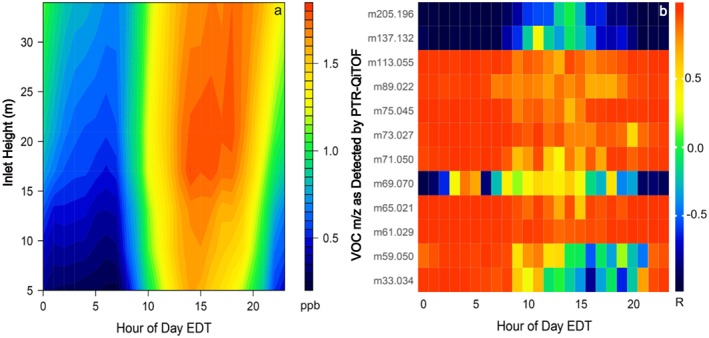
Figure 4.

In‐canopy vertical gradients of HCOOH and correlations with tracers of known origin. (a) Curtain plot showing the mean diel cycle of HCOOH vertical gradients for the PROPHET‐AMOS campaign. (b) Mean hourly correlations between the HCOOH vertical gradients and those for selected other VOCs: m/z 33.034 = methanol; m/z 59.050 = acetone; m/z 61.029 = acetic acid/glycolaldehyde; m/z 65.021 = CH5O3 +; m/z 69.070 = isoprene; m/z 71.050 = MVK + MACR; m/z 73.027 = methylglyoxal; m/z 75.045 = hydroxyacetone; m/z 89.022 = C3H5O3 +; m/z 113.055 = C6H9O2 +; m/z 137.132 = monoterpenes; m/z 205.196 = sesquiterpenes.
