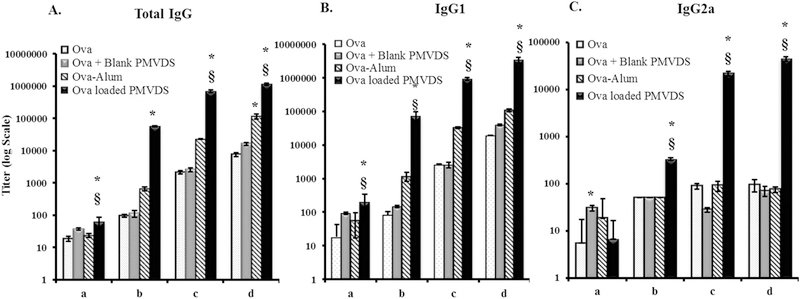
Fig. 5.
Ova-specific antibody titers in immunized mice serum. Mice (n = 4–5 per group) were injected intradermally with ova (100 μg) alone or along with alum (250 μg) or InAc microparticles (~2.0 mg), or loaded inside InAc-PMVDS (~2.0 mg) on days 1 and 21 as primary and booster doses. Sera were collected at 1 and 3 weeks after each immunization for analysis of IgG titers using indirect ELISA. The Y-axis is plotted as Log10 scale. Groups ‘a’ and ‘b’ represent one week and three weeks’ time point after primary immunization, respectively. Groups ‘c’ and ‘d’ represent one week and three weeks’ time points after booster injections, respectively. Data represents mean ± standard deviation (n = 4–5). * and § indicates that the results are statistically significant at p < 0.05 as compared to ova group and ova-alum group, respectively using one way-ANOVA followed by Bonferroni’s multiple comparison test.

