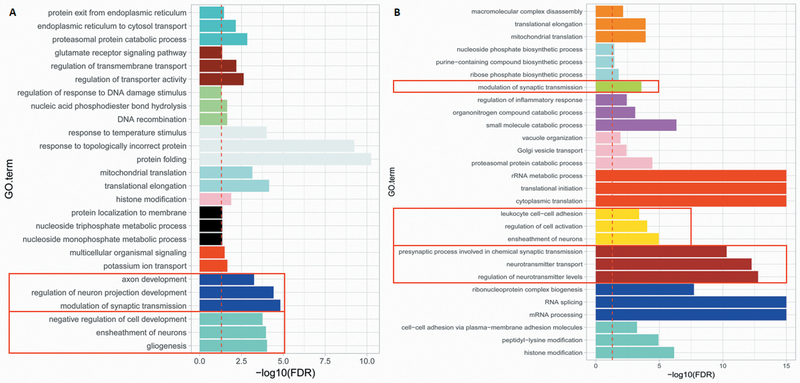
Fig. 2. Functional annotation of CNV-lncRNA coexpression modules.
Modules containing CNV-lncRNAs are represented as horizontal bars with different colors. Neuronal modules (turquoise and blue) from the BrainGVEX data set (human adult control brains, N = 259) (A), and neuronal modules (brown, yellow, and greenyellow) from the Developmental Capstone data set (developing human brains, N = 37) (B) are indicated within the red box. The red dashed line indicates FDR = 0.05. For each module, the top 3 Gene Ontology (GO) terms (FDR < 0.05) are listed on the y axis, and values of -log10(FDR) are shown on the x axis.

