
Fig. 2. Intestinal tumors from APC-deficient mice facilitate glycolysis by using both glucose and fructose.
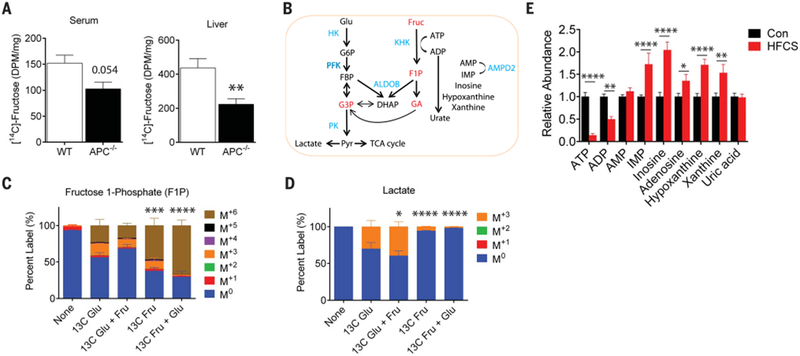
(A) The amount of radioactivity in the serum (left) and liver (right) 20 min after an oral bolus of HFCS that contained U-[14C]-fructose tracer in wild-type (WT) (n = 4) and tumor-bearing APC−/− mice (n = 6). Radioactivity amount is presented as disintegrations per minute (DPM) per microliter (serum) or per microgram of protein input (liver). WT and APC−/− compared by Student’s t test, **P < 0.01. (B) Schematic depicting key enzymes and metabolites in glycolysis, fructolysis, and purine salvage pathways. Red indicates key fructose metabolites; blue indicates enzymes. Glu, glucose; Fruc, fructose; G6P, glucose 6-phosphate; FBP, fructose 1,6-bisphosphate; G3P, glyceraldehyde 3-phosphate; Pyr, pyruvate; F1P, fructose 1-phosphate; GA, glyceraldehyde; DHAP, dihydroxyacetone phosphate; ATP, adenosine triphosphate; ADP, adenosine diphosphate; AMP, adenosine monophosphate; IMP, inosine monophosphate; HK, hexokinase; PFK, phosphofructokinase; PK, pyruvate kinase; ALDOB, aldolase B; KHK, ketohexokinase; AMPD2, AMP deaminase 2. (C) Percent labeling of fructose 1-phosphate and (D) lactate following a 10-min ex vivo incubation with 10 mM U-[13C]-glucose, 10 mM U-[13C]-glucose with 10 mM fructose, 10 mM U-[13C]-fructose, and 10 mM U-[13C]-fructose with 10 mM glucose. The isotopic labeling of each metabolite is indicated by the M+# designation indicated in the legend where the # represents how many [12C] were replaced with [13C]. For example, the M+3 species for fructose 1-phosphate has the chemical formula 13C312C3H13O9P. n = 3 to 4 per group. Two-way ANOVA with Holm-Sidak post-test compared to the U-[13C]-glucose condition. *P < 0.05, ***P < 0.001, ****P < 0.0001, 13C Glu, U-[13C]-glucose; 13C Fru, U-[13C]-fructose. (E) Relative abundance of key metabolites in the adenine purine salvage pathway. Con (n = 14), HFCS (n = 9). Two-way ANOVA with Holm-Sidak post-test *P < 0.05, **P < 0.01, ***P < 0.001, ****P < 0.0001. All data represent means ± SEM.