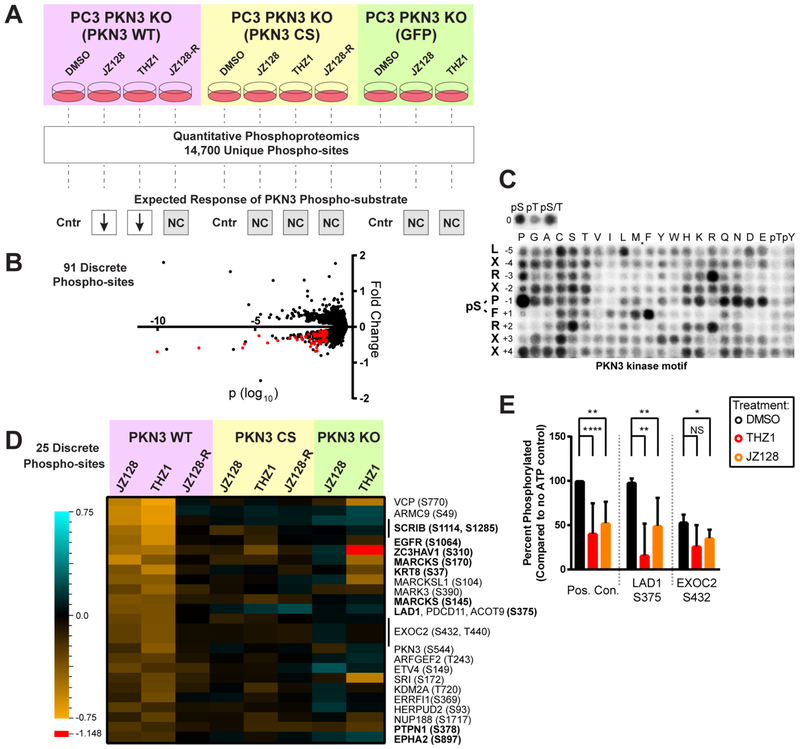
Figure 5.
Phosphoproteomic discovery of potential PKN3 substrates. (A) Illustration of genetic and chemical controls, experimental workflow, and the expected response of a direct PKN3 phosphorylation substrate under the conditions tested. Each experimental treatment was compared to its matched DMSO control (Cntr). Only the JZ128 and THZ1 treatments in the WT PKN3 background were expected to mediate reduced phosphorylation (down arrows). All other treatment conditions were expected to show no change (NC). 91 phospho-sites fit these criteria. (B) Representative volcano plot showing the fold change and log10; p-value of 14,700 reproducibly quantified phosphorylation sites. The p-values were determined by use of a variance model as previously described.38,39 Data for the PKN3 WT JZ128 treatment vs PKN3 WT DMSO treatment is shown. Red dots comprise the 91 phosphorylation sites that met all criteria in A for potential direct substrates of PKN3. See Table S5 for the complete data set and analysis. (C) PKN3 motif derived from analysis of randomized peptide library. See Table S6 for quantified densitometry values. The 91 phosphorylation sites meeting the regulation criteria were further reduced to a set of 25 putative substrates based on a composite motif score: (i) sequence-similarity to the predicted PKN3 motif and (ii) relative match to the predicted PKN3 motif compared to a larger set of 191 ser/thr kinase motifs derived from analysis of the randomized peptide library. (D) Heat map of fold change values for the 25 phosphorylation sites meeting all criteria for potential direct substrates of PKN3. The single red cell (value = −1.148) in the heatmap is outside the range of the legend. (E) PKN3 in vitro phosphorylation of synthetic peptides which exhibited reduced phospho-serine levels in PKN3 WT cells treated with JZ128/THZ1, and closely matched our predicted PKN3 motif. Bar graphs show percent phosphorylation of each site compared to no ATP control conditions across four replicate experiments. Positive control is the same synthetic peptide used for in vitro kinase assays with PKN3. THZ1 and JZ128 treatments were at 1 μM for 30 min prior to starting the assay. (N = 4–10 replicates) NS: p-value >0.05, *: p-value <0.05, **: p-value <0.001, ****: p-value = < 0.0001.

