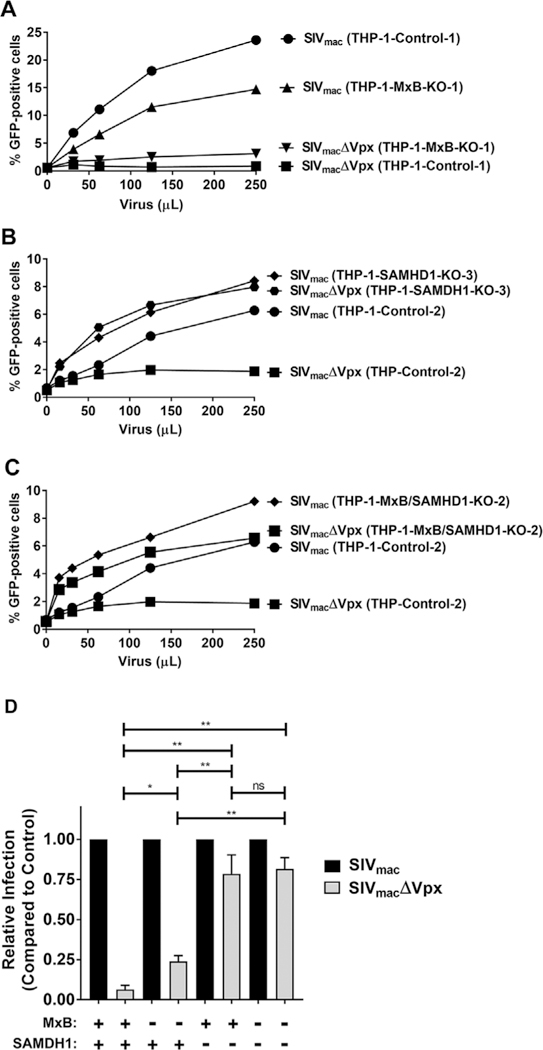
Fig. 3. Expression of MxB is not necessary for the ability of SAMHD1 to restrict SIVmac.

(A) Restriction of SIVmac in THP-1-MxB-KO cells. THP-1 and THP-1-MxB-KO cell lines were challenged with increasing amounts of SIVmac or SIVmacΔVPX expressing GFP as a reporter of infection. Infection is shown as the percentage of GFP-positive cells 72 h post-challenge as measured by flow cytometry. Experiments were performed in triplicate and a representative experiment is shown. 500 μL of SIVmac or SIVmacΔVPX represents a MOI of 2. (B) Restriction of SIVmac in THP-1-SAMHD1-KO cells. THP-1 and THP-1-SAMHD1-KO cell lines were challenged with increasing amounts of SIVmac or SIVmacΔVPX. Infection is shown as the percentage of GFP-positive cells 72 h post-challenge as measured by flow cytometry. Experiments were performed in triplicate and a representative experiment is shown. 500 μL of SIVmac or SIVmacΔVPX represents a MOI of 2. (C) Restriction of SIVmac in THP-1-MxB/SAMHD1-KO cells. THP-1 and THP-1-MxB/SAMHD1-KO cell lines were challenged with increasing amounts of SIVmac or SIVmacΔVPX. Infection is shown as the percentage of GFP-positive cells 72 h post-challenge as measured by flow cytometry. 500 μL of SIVmac or SIVmacΔVPX represents a MOI of 2. (D) Relative infection of SIVmac and SIVmacΔVPX in all cells. The results of three independent experiments with standard deviation are shown, * denotes P value of < 0.05, ** denotes P value of < 0.0001, ns denotes not significant as determined by One-Way ANOVA Tukey’s multiple comparisons test. Black bars represent SIVmac infection. Grey bars represent SIVmacΔVPX infection.
