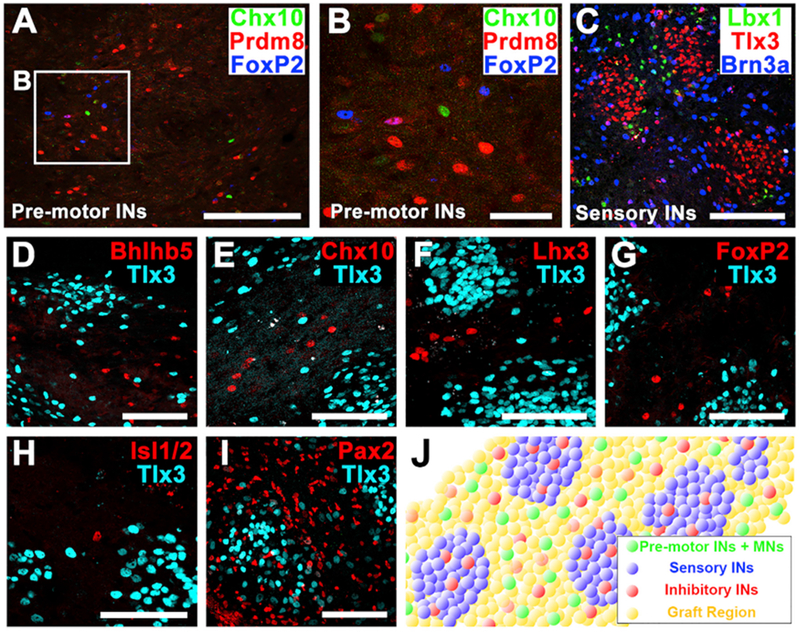
Figure 2. The Spatial Distribution of Neuronal Subtypes in 2-Week-Old Grafts.

(A and B) Immunolabeling for three motor interneuronal markers (Chx10, Prdm8, and FoxP2) demonstrating motor interneurons (INs) exist sparsely within the graft. Boxed area is shown in (B). Scale bars, 200 μm (A) and 50 μm (B).
(C) Immunolabeling for three sensory interneuronal markers (Tlx3, Lbx1, and Brn3a) demonstrating clustering into similar regional clusters. Scale bar, 100 μm.
(D–I) Immunolabeling for the sensory interneuronal marker Tlx3 with the pre-motor interneuronal markers (D) Bhlhb5, (E) Chx10, (F) Lhx3, (G) FoxP2, (H)the motor neuronal marker Isl1/2, and (I) the pan-inhibitory interneuronal marker Pax2. Note that grafted neurons expressing pre-motor interneuronal markers are distributed in between, but not within, sensory interneuronal clusters. Pax2-expressing inhibitory interneurons are uniformly dispersed throughout the graft in both motor and sensory domains. Scale bars, 100 μm.
(J) Schematic representation of distribution of pre-motor interneurons and motorneurons (pre-motor INs + MNs, green), sensory interneurons (sensory INs, blue), and inhibitory interneurons (red) within spinal cord neural progenitor cell graft (yellow).
