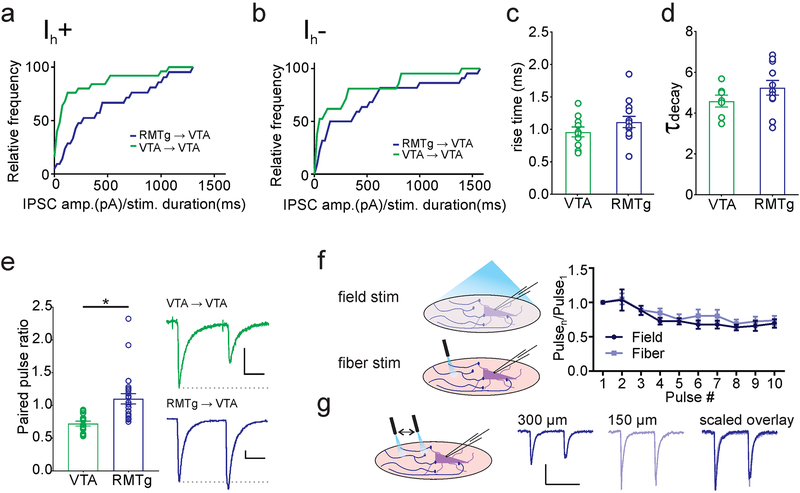
Figure 3. Basal properties of VTA→VTA and RMTg→VTA synapses.
(a) Both VTA (green) and RMTg (blue) inputs have synaptic connections with Ih+ cells in the VTA, though on average RMTg inputs have greater IPSC amplitudes per millisecond of light stimulation (VTA inputs: n = 25 cells/23 mice; RMTg inputs: n = 21 cells/21 mice). (b) VTA neurons lacking Ih receive inputs from both regions, and also have a greater RMTg IPSC per ms light stimulation (VTA inputs: n = 21 cells/21 mice; RMTg inputs: n = 22 cells/22 mice). (c) Comparison of rise time (10–90% of peak) and decay time constant (τdecay) between VTA inputs (n = 7 cells/6 mice) and RMTg inputs (n = 11 cells/9 mice). (e) RMTg inputs have a significantly greater paired-pulse ratio (PPR) than VTA inputs (* p = 0.01, Mann-Whitney U test; VTA inputs: n = 8 cells/6 mice; RMTg inputs: n = 23 cells/19 mice). Inset, paired light-evoked IPSCs from VTA (top) and RMTg (bottom). (f) Comparison of short-term depression of RMTg inputs using full-field and focal light-fiber illumination (n = 5 cells/4 mice). (g) Comparison of IPSCs elicited by a light-fiber placed at different distances from the cell body. Scale bars: 100 pA, 20 ms.

