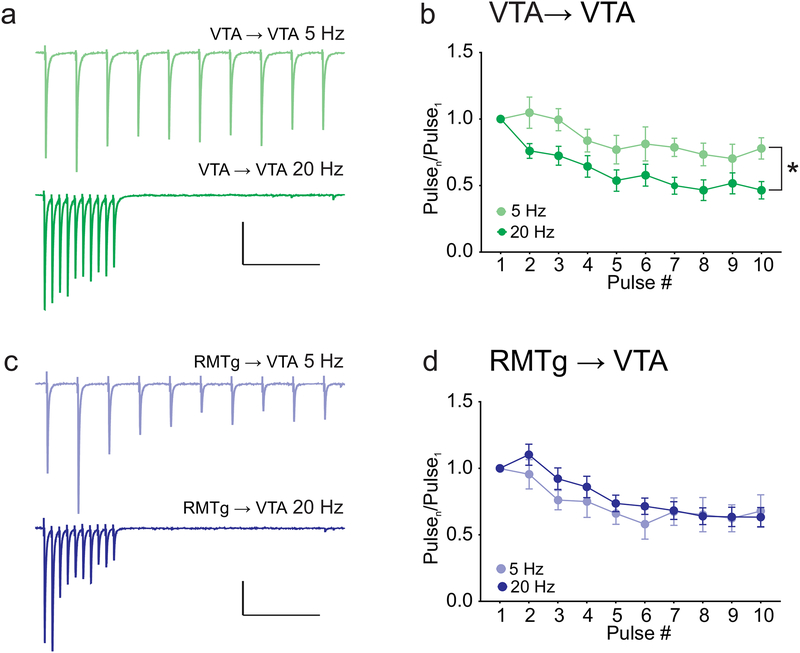
Figure 5. VTA→VTA IPSCs exhibit greater short-term synaptic depression at 20 Hz than at 5 Hz.
(a) Example IPSCs from VTA→VTA inputs evoked by trains of light stimulation at 5 Hz (top) and 20 Hz (bottom). (b) Summary of train data for VTA inputs, comparing 5 Hz and 20 Hz stimulation (* p = 0.03 effect of frequency, 2-way ANOVA; 20Hz: n = 8 cells/6 mice; 5 Hz n = 5 cells/5 mice). (c) Example IPSCs from RMTg→VTA inputs evoked by light stimulation at 5 Hz (top) and 20 Hz (bottom). (d) Summary of train data for RMTg inputs, comparing 5 Hz and 20 Hz stimulation. No significant effect of frequency, 2-way ANOVA (20 Hz: n = 23 cells/19 mice; 5 Hz: n = 6 cells/6 mice). Scale bars: 100 pA, 500 ms.

