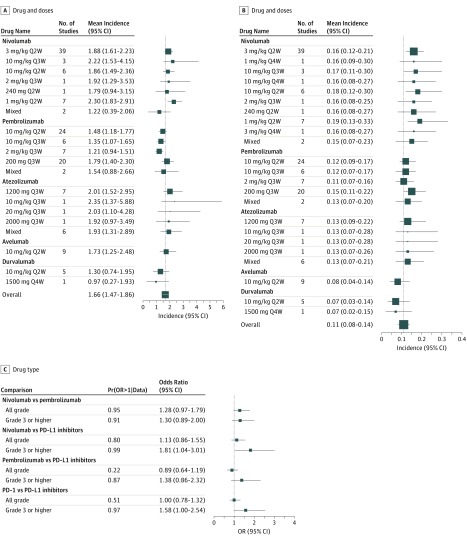
Figure 4. Mean Incidences of Adverse Events by Drug Type.
A, Mean incidences of all-grade adverse events by drug and dose; vertical line indicates the overall mean incidence of all-grade adverse events (1.66%). B, Mean incidences of grade 3 or higher adverse events by drug and dose. C, Comparisons of mean incidences of adverse events between different drugs. The vertical line indicates the overall mean incidence of grade 3 or higher adverse events (0.11%). For A and B, values to the left of the line are lower than mean, to the right, higher. For C, values to the left of the line are higher for second drug in the comparison, to the right, for first drug in comparison. PD-1 indicates programmed cell death; PD-L1, programmed cell death ligand 1.

