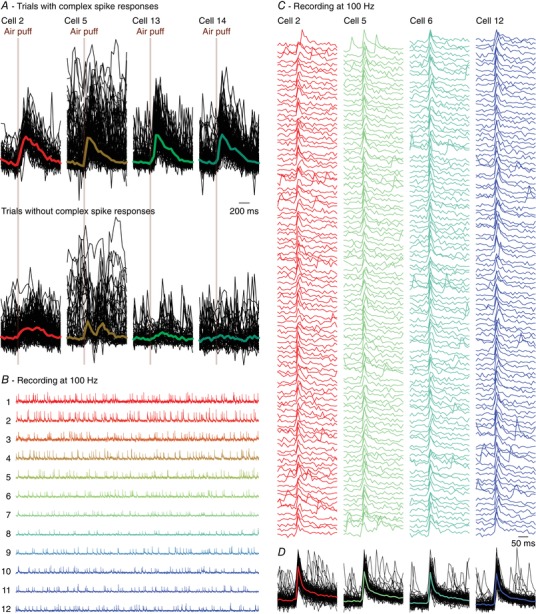
Figure 3. Complex spike detection.

A, from the same experiment as illustrated in Fig. 2, we randomly selected four Purkinje cells of which all trials with (top) and without (bottom) a complex spike within 200 ms of stimulus onset are shown. The signals are scaled to the maximum of the median complex spike responses. The fat coloured lines indicate the medians, with the same colour code as in Fig. 2. Trials without a complex spike response can still show increased fluorescence, but the kinetics of the non‐complex spike response differed from those of the complex spike responses. Note that the raw trace of cell 5 had a period with increased noise levels, making it the least reliable cell of this recording. Nevertheless, cell 5 had a complex spike response profile that was very similar to those of the other cells (see dashed line in Fig. 2 G). Cells (in other recordings) that had a signal‐to‐noise ratio worse than for cell 5 of this recording were excluded from analysis. B, to better characterize rise times, we made recordings with a smaller field of view, but a higher temporal resolution (100 Hz). Shown are 60 s traces of 12 simultaneously recorded Purkinje cells. C, of four randomly selected Purkinje cells, the first 100 events were plotted and superimposed (D). The coloured lines in D indicate the medians. Virtually all events had a rise time of 10 or 20 ms (one or two frames).
