
Figure 4. Purkinje cells in crus 1 respond to various types of sensory stimulation.
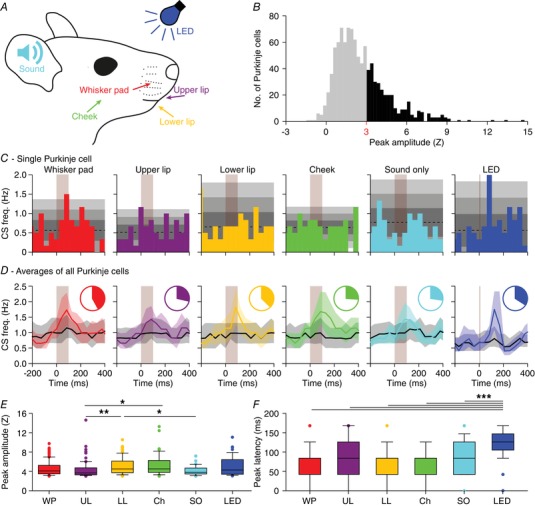
A, tactile stimuli were presented to four facial regions in awake mice: the whisker pad (WP), the upper lip (UL), the lower lip (LL) and the cheek (Ch). Each stimulus was delivered with a piezo‐actuator that made a muted, yet audible sound which was also delivered without touch [‘sound only (SO)’]. A blue light flash generated by an LED was used as the visual stimulus. These experiments were performed in awake mice. B, to avoid interference of adjacent areas, we applied gentle touches (0.686 mN). The complex spike response ratio was much reduced relative to the strong air puff stimulation to all ipsilateral whiskers illustrated in Fig. 2. A histogram of the peak responses (expressed as Z value) of all responses to either of the four tactile stimuli demonstrates that the response strength is a continuum, showing the lack of a clear separation between ‘responsive’ and ‘non‐responsive’ Purkinje cells (998 stimulus conditions in 282 Purkinje cells). We considered Purkinje cells that showed a peak response above Z = 3 as ‘significantly responsive’ (represented with black bars), but we provide most of the analyses also for the population as a whole (e.g. Fig. 5). C, peri‐stimulus time histograms (PSTHs) of a representative Purkinje cell. The shades of grey indicate 1, 2 and 3 SD around the average. Each stimulus was repeated 154 times at 1 Hz. D, for every stimulus condition, we averaged the PSTHs for all Purkinje cells that were significantly responsive to that particular stimulus [coloured lines; medians (interquartile range)]. These were contrasted to the averaged PSTH of the other Purkinje cells (black lines). The pie charts represent the fraction of Purkinje cells significantly responsive to a particular stimulus. See also Table 1. E, peak responses of the significantly responding Purkinje cells were lowest for sound‐only and for upper lip stimulation. * P < 0.05; ** P < 0.01 (post hoc tests after Kruskal–Wallis test). F, as expected for complex spike responses to weak stimulation, the latencies were relatively long and variable, but consistent across types of stimulation. Only visual stimulation (LED) had a remarkably longer latency time. *** P < 0.001 (post hoc tests after Kruskal–Wallis test for LED vs. whisker pad, upper lip, lower lip and cheek and P < 0.05 compared to sound only).