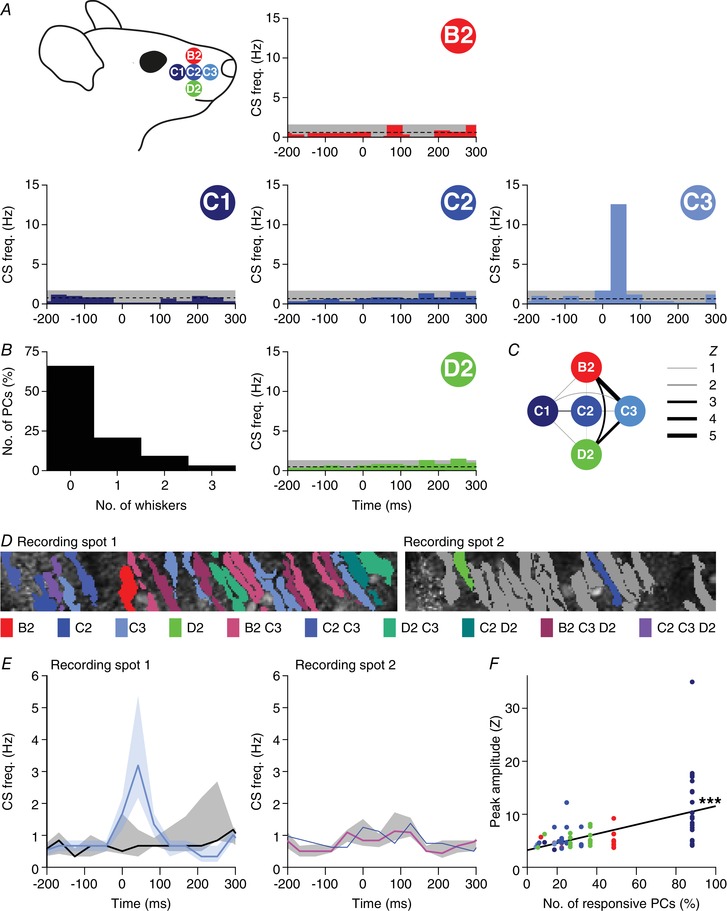
Figure 11. Purkinje cell responses to single whisker stimulation show weak clustering.

A, to investigate smaller receptive fields, we sequentially stimulated five of the large facial whiskers. To avoid interference with other whiskers during active movement, we performed these experiments under ketamine/xylazine anaesthesia. Most Purkinje cells, if responsive to single‐whisker stimulation, responded only to one of the five whiskers (B). This is illustrated by five peri‐stimulus time histograms (PSTHs) from a single, representative Purkinje cell. This particular cell was sensitive to stimulation of the C3 whisker only. The average and 3 SD of the baseline firing are indicated (dashed line and grey area). C, Purkinje cells that responded to more than one whisker were typically responsive to the more anterior whiskers (see also Table 5). The widths of the lines indicate the Z value of the occurrence of multiple responses per cell. D, two recording spots, in close proximity in crus 1 of the same animal, with the identified Purkinje cell dendritic trees. For each dendrite, the colour indicates the whisker(s) to which it was responsive (see legend below with grey denoting the absence of a statistically significant response). E, for each of the two recording sites, the medians of the responsive and the non‐responsive Purkinje cells are indicated (to the C3 whisker in the left panel and to the C2 whisker in the right panel). Note that only a single cell was responsive to C2 stimulation in recording spot 2. The shades indicate interquartile ranges. F, linear regression revealed that Purkinje cells that were surrounded by other Purkinje cells responsive to the same whisker (same colour code as in A) tended to show stronger responses to stimulation of that whisker than Purkinje cells that were more isolated. The x‐axis represents the fraction of Purkinje cells responsive to the particular whisker within the respective field of view. r = +0.52, P < 0.001.
