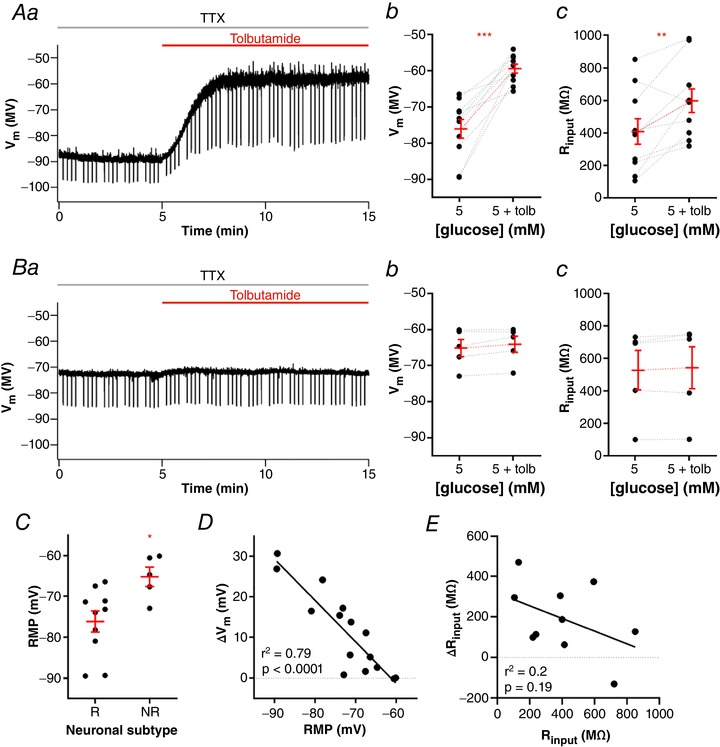
Figure 1. NTS neurons present active KATP channels.

A, representative recording of a neuron responsive to tolbutamide (Aa) and summary of the tolbutamide effect on membrane potential (V m; Ab) and input resistance (R input; Ac) of neurons. B, representative recording of a neuron unresponsive to tolbutamide (Ba) and summary of the tolbutamide effect on V m (Bb) and R input (Bc) of neurons. C, comparison of the resting membrane potential (RMP) between neurons responsive (R) and unresponsive (NR) to tolbutamide. D, linear correlation between the change of V m induced by tolbutamide and the RMP of neurons. E, linear correlation between the change of R input induced by tolbutamide and the basal R input of neurons. Tolb, tolbutamide; TTX, tetrodotoxin. * P < 0.05; ** P < 0.01; *** P < 0.001. [Color figure can be viewed at wileyonlinelibrary.com]
