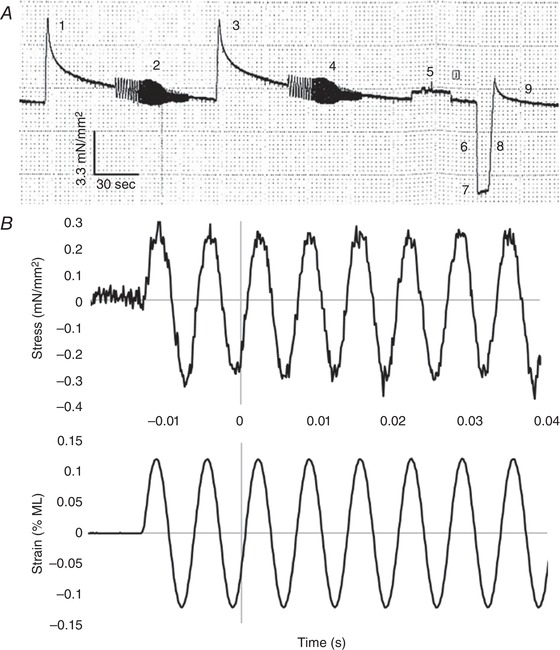
Figure 4. Representative stress and strain traces.

A, an example low time resolution tension trace from a control fibre is shown. Numbers 1–9 indicate events during the experiment. The first portion of the trace shows how we determined optimal fibre length. Because it is not possible to measure IFM sarcomere length, we instead stretch the fibre in increments of 2% of its muscle length (labelled 1 and 3) and run a sinusoidal analysis at each length (labelled 2 and 4) until the power does not increase by more than 3%. The final sinusoid run is performed at the optimal length. This length is used for the remainder of the experiment. The perturbation at 5 is due to removing the cover over the mounted fibre to visually check fibre integrity. At 6 we are shortening the muscle to slack length to determine 0 tension (baseline) (labelled 7). Label 8 is where we return the fibre to its optimal length. Label 9 is gradual tension recovery. We allow the fibre to recover for 2 min before measuring active isometric tension. B, example high time resolution traces (8 kHz) of a portion of our sinusoidal analysis perturbations (2 and 4 in A). Recorded stress (top) and strain (bottom) traces for control fibres are shown for a 0.125% ML change sinusoidal perturbation at 150 Hz. Note that the first couple of cycles are not included in the analysis (to allow the response to achieve a steady state) and this is why 0 s is not at the start of the trace. A total of 77 cycles were run at this frequency. The average amplitude and phase of the stress response relative to the strain is used to calculate elastic and viscous moduli, as well as work and power.
