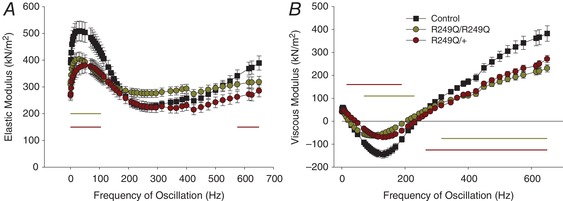
Figure 8. Elastic and viscous modulus versus muscle length oscillation frequency.

A, both mutant fibre types show lower elastic modulus (stiffness) values at frequencies indicated by the horizontal lines (one‐way ANOVA; P < 0.05). B, the smaller negative viscous modulus values of the R249Q mutants indicate these fibres produce less work. Horizontal lines show where the viscous modulus is significantly different from the control (one‐way ANOVA; P < 0.05). n = 12 for each fibre type.
