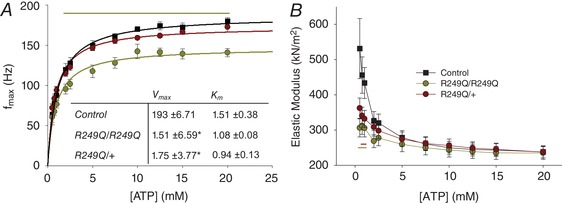
Figure 9. Fibres’ response to changing ATP concentrations.

The experiment was conducted starting with 20 mm ATP and decreasing to 0.5 mm. A, f max values plotted over changing [ATP], and fitted with the Michaelis‐Menten equation. The table inset lists the mean and SEM for Michaelis‐Menten parameters K m and V max. *Significant difference from the control. The yellow horizontal line indicates at which concentrations homozygous f max is significantly lower (one‐way ANOVA; P < 0.05). n = 12 for control, n = 11 for heterozygous, and n = 10 for homozygous fibres. B, elastic modulus values plotted against [ATP]. Yellow and red horizontal lines show where homozygous and heterozygous fibres differ significantly (one‐way ANOVA; P < 0.05) in stiffness from the control. n = 12 for control fibres and n = 11 for homozygous and heterozygous fibres.
