Figure 1.

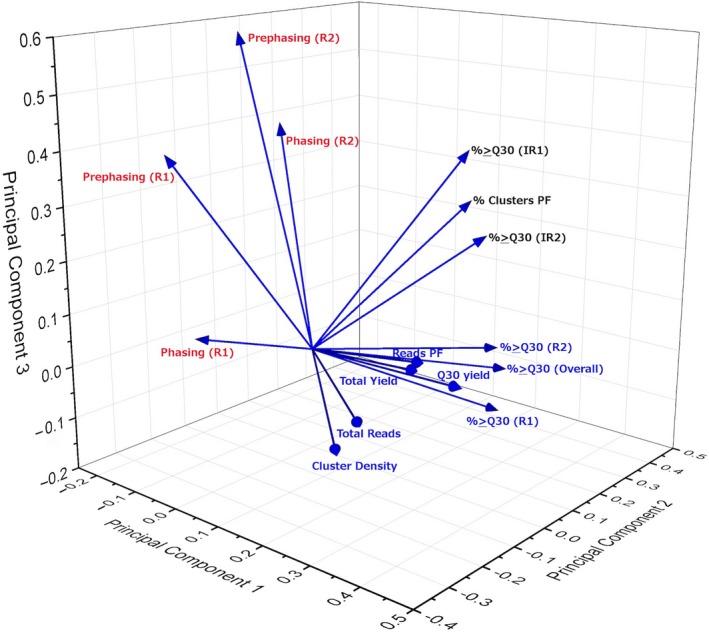
PCA loading plot of the 15 observed MiSeq run metrics across 486 MiSeq runs. Three groups can be distinguished from the plot and are indicated in different colours [Colour figure can be viewed at wileyonlinelibrary.com]

PCA loading plot of the 15 observed MiSeq run metrics across 486 MiSeq runs. Three groups can be distinguished from the plot and are indicated in different colours [Colour figure can be viewed at wileyonlinelibrary.com]