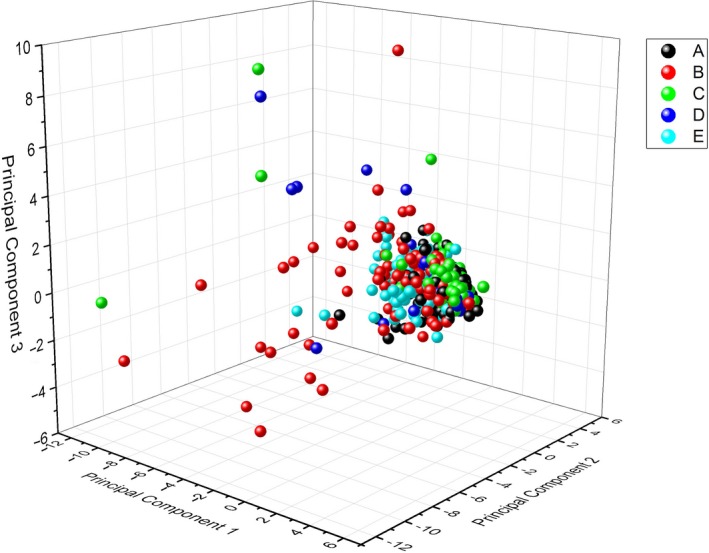
Figure 2.

A three‐dimensional PCA plot of each MiSeq instrument. Each colour represents a particular MiSeq desktop sequencer (MiSeq A–E), and each point on the plot represents a single observation (2 × 250 500 cycle V2 MiSeq sequencing run) [Colour figure can be viewed at wileyonlinelibrary.com]
