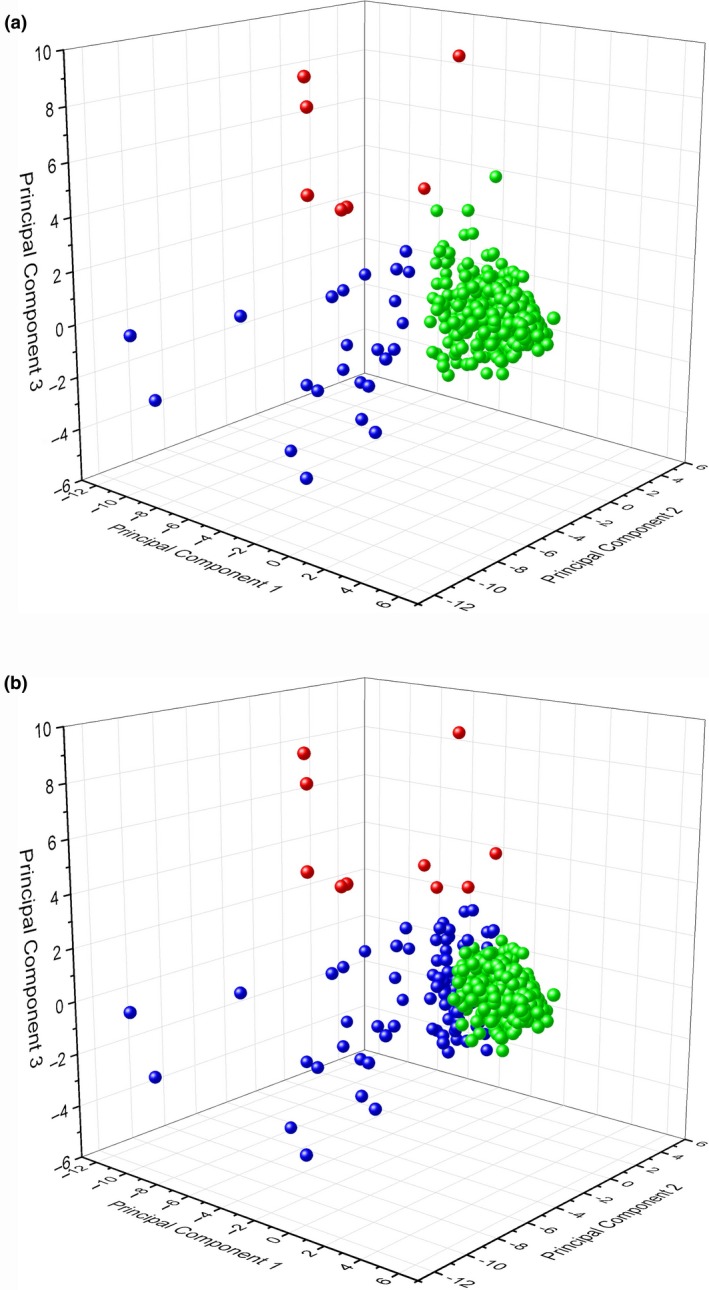
Figure 3.

(a) A three‐dimensional k‐means cluster analysis plot of the PCA (Euclidean). The analysis was run several times with a priori number of clusters from 2 to 5. In this plot, higher quality MiSeq runs, which exhibited metrics that met performance criteria, are represented by the green cluster, MiSeq runs that failed primarily due to %≥Q30 issues are represented in blue, and MiSeq runs that failed due to Phasing or Prephasing are depicted in red. (b) A three‐dimensional k‐means cluster analysis plot of the PCA (Mahalanobis). The analysis was run several times with a priori number of clusters from 2 to 5. In this plot, higher quality MiSeq runs, which exhibited metrics that met performance criteria, are represented by the green cluster, MiSeq runs that failed due to %≥Q30 issues and other metrics are represented in blue, and MiSeq runs that failed due to Phasing or Prephasing and other metrics are depicted in red [Colour figure can be viewed at wileyonlinelibrary.com]
