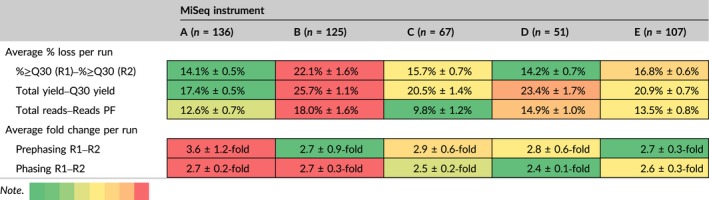
Table 3.
Heatmap comparison of changes in run metrics between the start and end of a MiSeq sequencing run for each MiSeq instrument. “n” is equal to the number of MiSeq runs performed per sequencer. Values represent the arithmetic means + SE. The color palette in the note indicates the range of the most favorable average % loss/fold changes (green) to least favorable average % loss/fold changes (red), comparatively for the 5 MiSeq instruments [Colour table can be viewed at wileyonlinelibrary.com]