Figure 6.

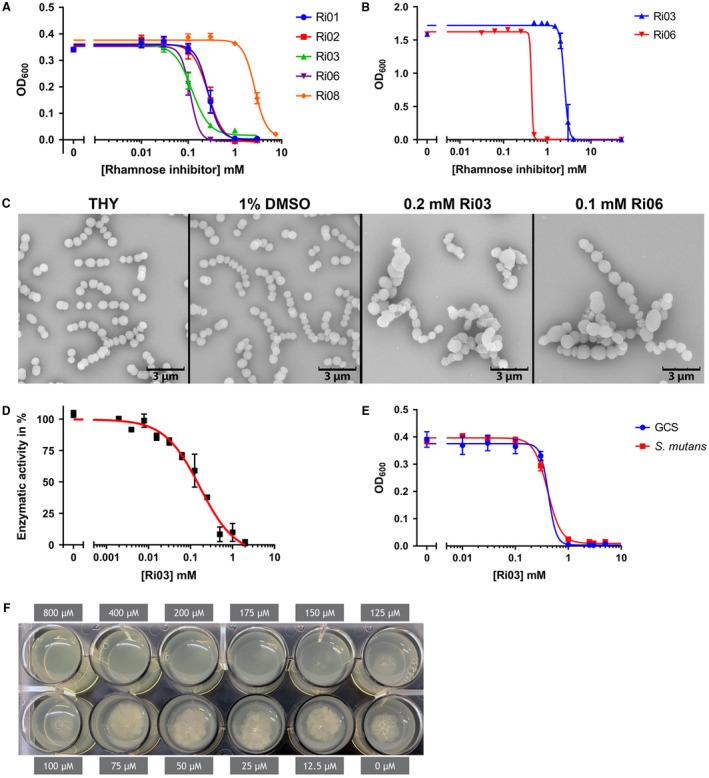
Fragment Ri03 inhibits dTDP‐L‐rhamnose biosynthesis in vitro and growth of streptococci and M. tuberculosis in vivo. A. Dose–response curves for growth inhibition of GAS with various concentrations of Ri01, Ri02, Ri03, Ri06 or Ri08. IC50 values range from 110 µM to 2.67 mM. B. Dose–response curves for growth inhibition of rhamnose‐deficient S. aureus with various concentrations of Ri03 and Ri06. IC50 values range are 2.48 mM and 440 µM respectively. C. Representative scanning electron microscopy images of GAS after 16 h incubation in growth medium (THY), or THY with the addition of 1% DMSO, 0.2 mM Ri03 or 0.1 mM Ri06. D. Dose‐dependent inhibition of dTDP‐L‐rhamnose biosynthesis using recombinant RmlB, C and GacA in a biochemical assay. The assay was initiated by the addition of 400 µM dTDP‐D‐glucose and conversion was measured through oxidation of NADPH to NADP+ at 340 nm. Background absorbance was subtracted and IC50 value was determined using the nonlinear fit model E. Dose–response curves for growth inhibition of S. equi subsp. zooepidemicus (Group C Streptococcus; GCS) and S. mutans with various concentrations of Ri03. IC50 values are 420 µM and 410 µM respectively. F. Ri03 prevents growth of M. tuberculosis with a minimal inhibitory concentration of 175 µM using an agar‐based spot culture growth inhibition assay. Dose–response curves represent mean ± SEM of at least three biological experiments performed in duplicate, except for M. tuberculosis MIC, which was performed twice.
