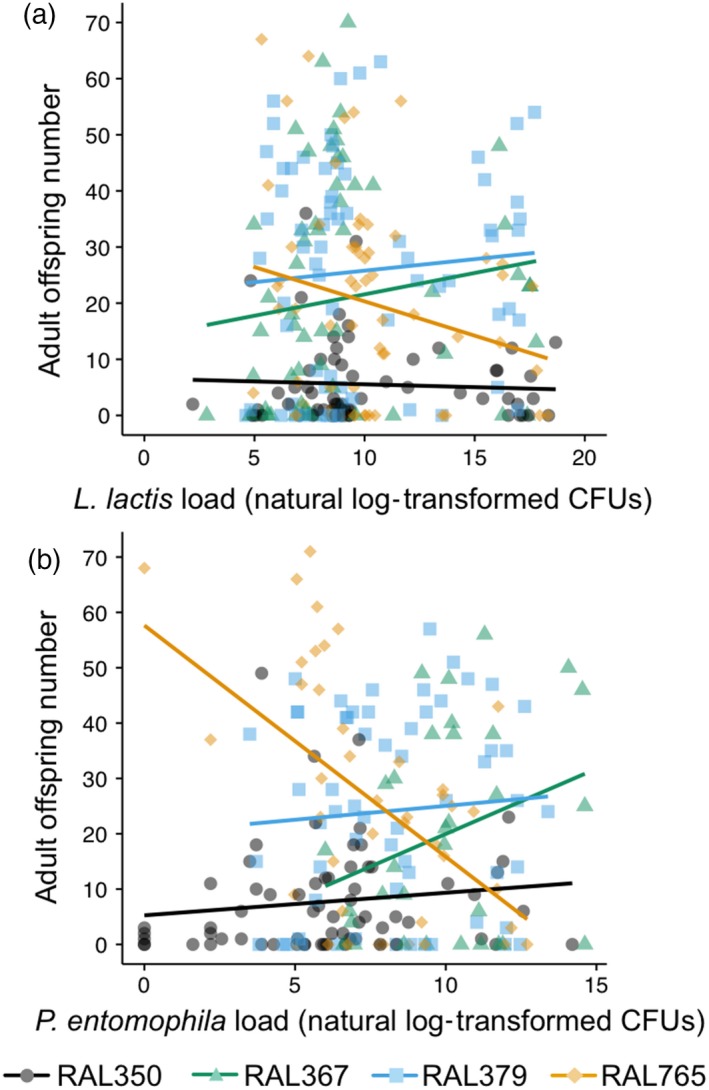
Figure 3.

Fecundity tolerance varies according to genotype one day post‐challenge (DPC). Tolerance reaction norms are plotted for each genotype infected with (a) Lactococcus lactis and (b) Pseudomonas entomophila. The natural log of bacterial load (CFU) is plotted against fecundity one DPC. Each data point represents bacterial load and fitness for one fly. For statistics, see Table 2
