
Figure 4.
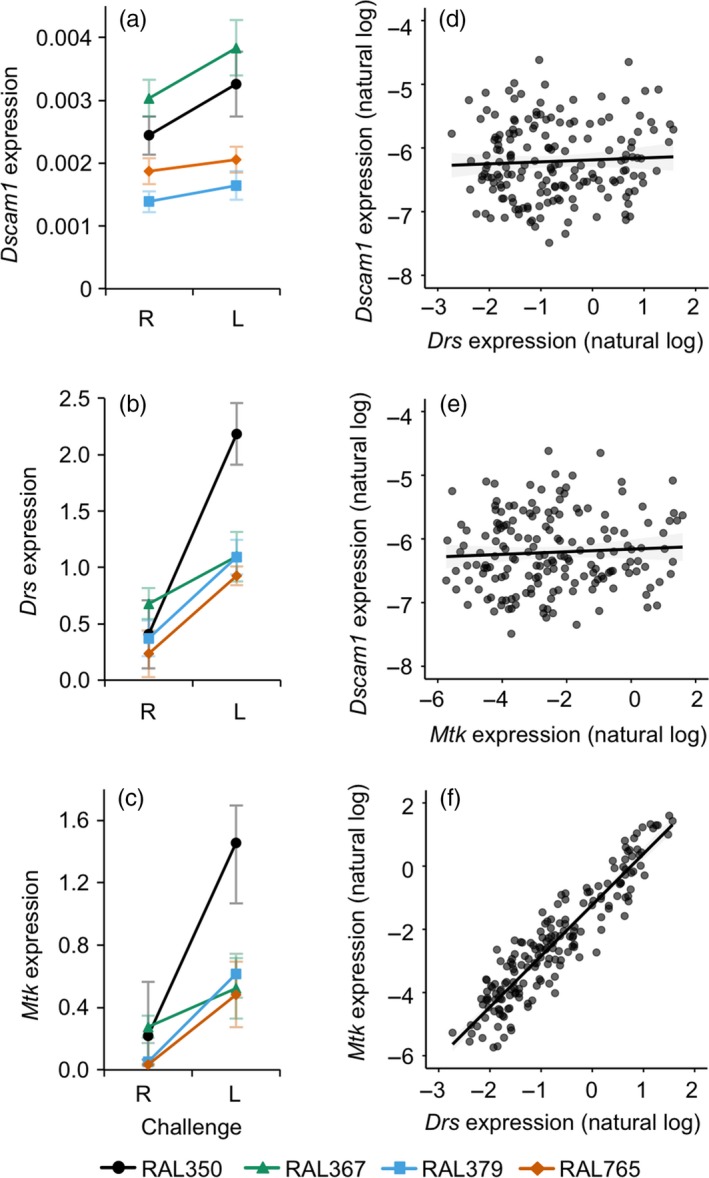
Target gene expression relative to reference gene expression one day post‐challenge (DPC). R indicates Ringer's, and L indicates Lactococcus lactis. The left panel shows gene expression (fold expression values, 2‐ΔCT) according to challenge and genotype, and the right panel shows correlations between the expression level of different gene pairs. (a) Dscam1, where expression increased significantly upon challenge; (b) Drosomycin and (c) Metchnikowin where the interactions between genotype and challenge in both panels are statistically significant. Symbols and error bars indicate means with standard errors, where n = 16‐24 per symbol. Reaction norms are plotted for each genotype. The legend at the bottom indicates the genotypes in panels a–c. For statistics, see Table 3. (d–f) Correlations between the expression of the three genes. Each data point is from one individual; the lines illustrate linear fits. For statistics, see Results in text