
Figure 6.
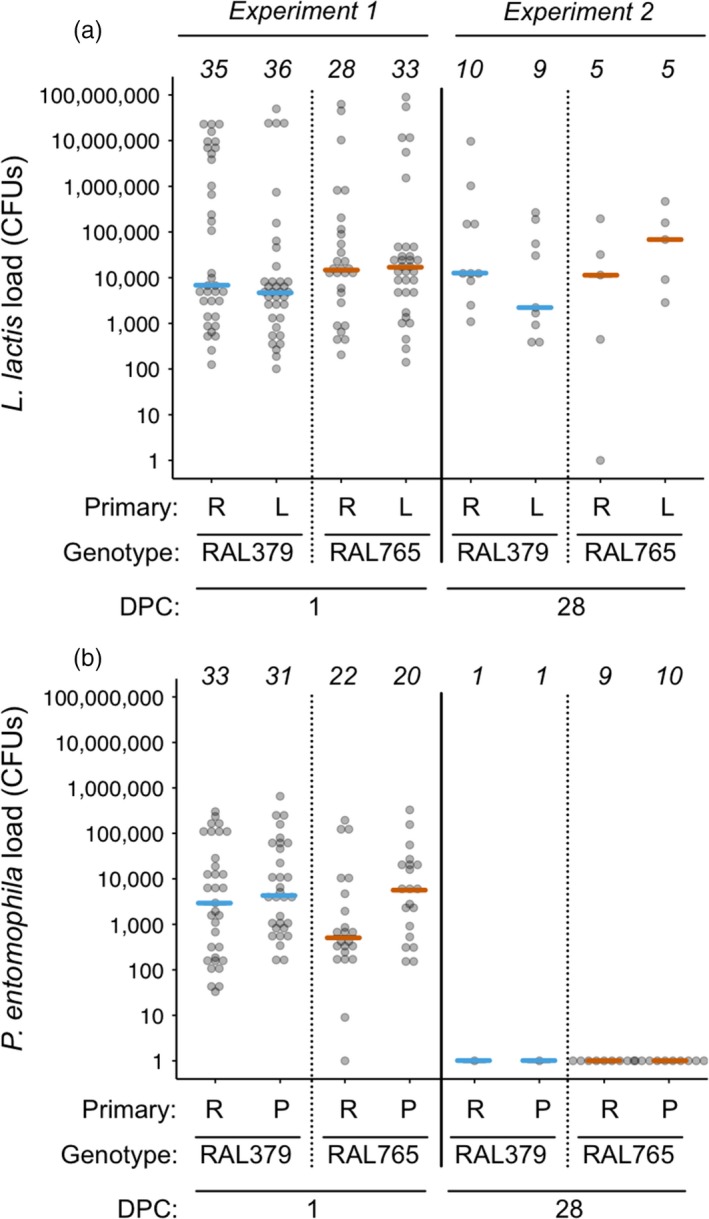
Bacteria load one and 28 day post‐challenge (DPC). (a) Lactococcus lactis and (b) Pseudomonas entomophila load quantified as the number of colony‐forming units (CFUs) per individual fly. The analyses were performed using ln(x)‐transformed data, but for ease of interpretation, we here present untransformed values on a log(x) scale. Sample sizes are given across the tops of the figures. In experiment 1, flies were homogenized at one DPC, and in experiment 2 at 28 DPC. Each dot shows the load for one fly, and the coloured lines indicate medians. For statistics, see Table 5