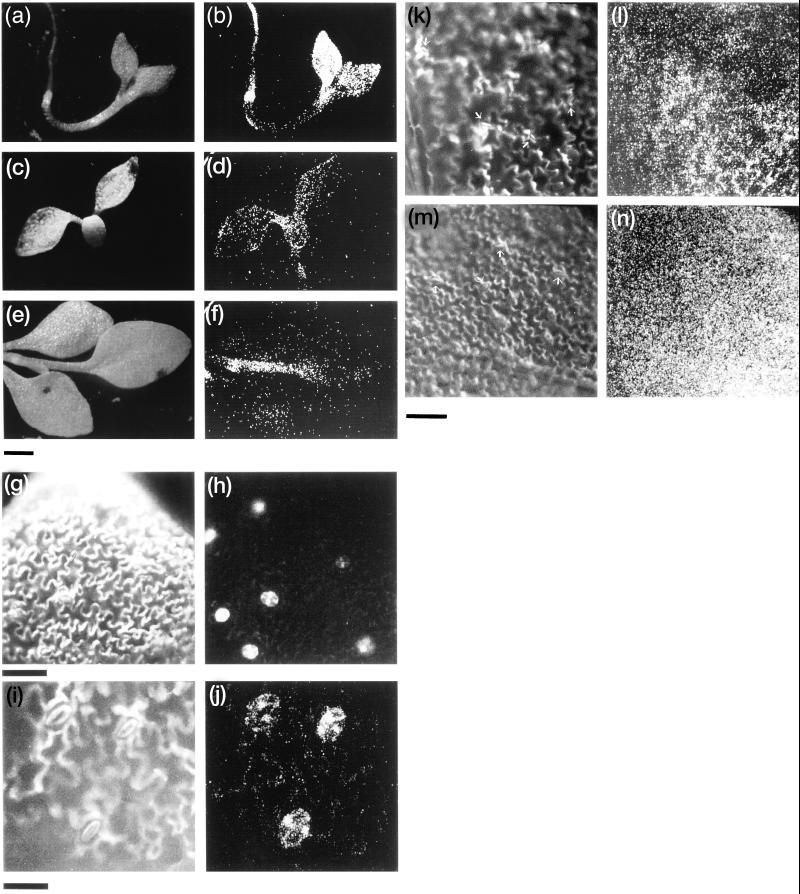
Figure 5.
Patterns of aequorin discharge in the three transgenic lines. Bright field images of MAQ2.4 (a), MAQ15 (c), and MAQ16 (e) transgenic seedlings. b, d, and f, The corresponding luminescent images of active aequorin discharged from each by a freeze-thaw cycle in the presence of 10 mm CaCl2. Magnification ×20. The bar beneath e represents 1 mm. g and i, Bright field images of MAQ2.4 seedlings; h and j, the corresponding luminescent images at ×200 and ×400, respectively. The bars under g and i represent 100 and 50 μm, respectively. k and m, Bright field images of MAQ15 and MAQ16 plants (arrows denote positions of stomates); l and n, the corresponding luminescent images at ×400 magnification. Bar size is the same as Figure 5 (i) and 50 μm.

