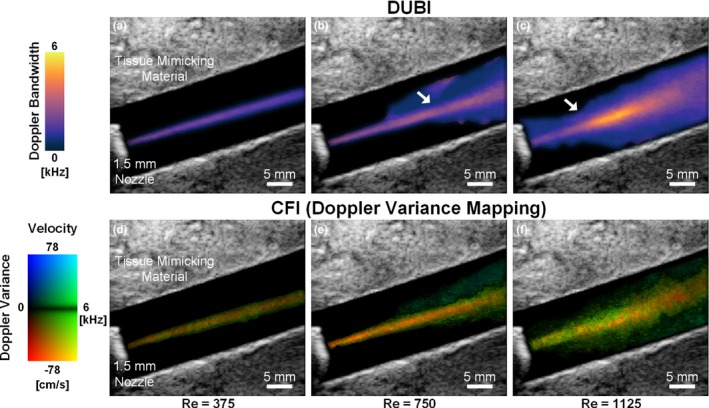
Figure 3.

Maps of mean Doppler bandwidth (top row; derived from DUBI) and mean Doppler variance (bottom row; derived from CFI variance mapping) acquired over a 0.5‐s period in a nozzle‐flow phantom. Results for three Re values are shown: 375 (left column), 750 (middle column), and 1125 (right column). The white arrows indicate the intermediate boundaries between stable flow (narrow flow stream) and unstable flow (diverging pattern). [Color figure can be viewed at wileyonlinelibrary.com]
