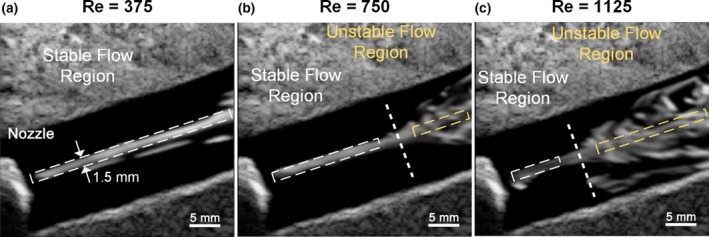
Figure 4.

Representative CEUS image frames obtained from (a) Re = 375 with persistence = 240 frames, (b) Re = 750 with persistence = 120 frames, and (c) Re = 1125 with persistence = 80 frames. Thick dash lines identify the intermediate boundaries; flow traces were straight before the dash line but began to diverge afterwards. The white and yellow boxes (1.5 mm in height) respectively indicate the stable and unstable flow region used for ROC analysis. [Color figure can be viewed at wileyonlinelibrary.com]
