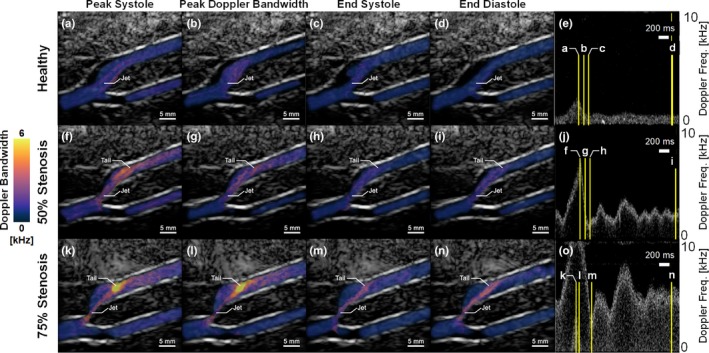
Figure 6.

DUBI frames at different phases of the cardiac cycle. Top, middle, and bottom rows respectively show Doppler bandwidth maps measured from (a–d) healthy, (f–i) 50% eccentric stenosis and (k–n) 75% eccentric stenosis bifurcation phantoms with their corresponding Doppler spectrogram shown on the rightmost column (e, j, o). First to fourth columns show frames captured at (a, f, k) peak systole, (b, g, l) peak flow disturbance, (c, h, m) end systole and (d, i, n) end diastole respectively with their relative time points indicated on the spectrograms. [Color figure can be viewed at wileyonlinelibrary.com]
