Figure 7.

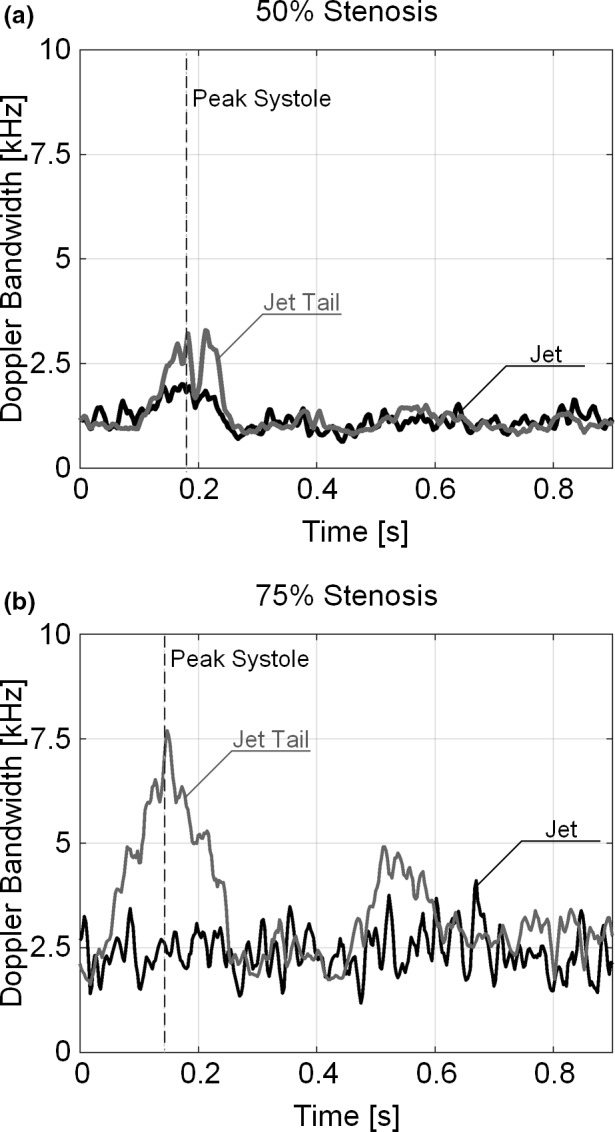
Time traces of Doppler bandwidth acquired at the jet (dark line) and the jet tail (gray line) as marked in Movie S3 for (a) 50% and (b) 75% stenosed bifurcation. The gray dotted line marks the time point at peak systole.

Time traces of Doppler bandwidth acquired at the jet (dark line) and the jet tail (gray line) as marked in Movie S3 for (a) 50% and (b) 75% stenosed bifurcation. The gray dotted line marks the time point at peak systole.